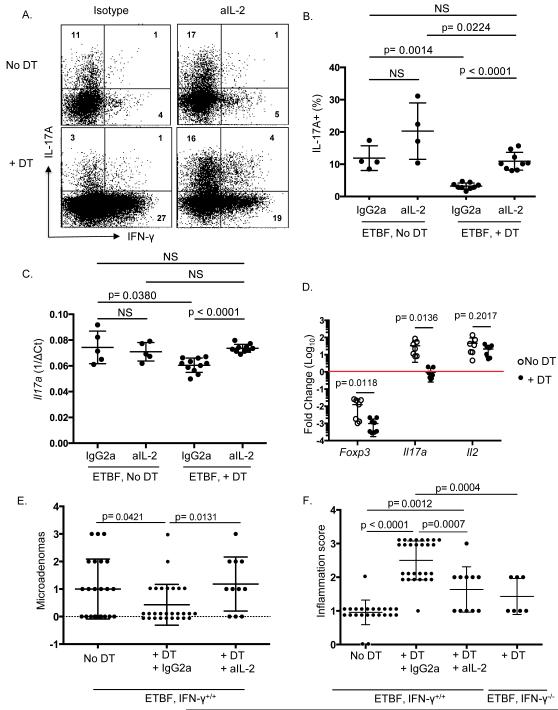
Figure 5. Anti-IL-2 restores the Th17 response to ETBF in the absence of Foxp3+ Tregs.
A) 4-9 B6.Foxp3DTR mice per group were inoculated with ETBF. Either 150 μl purified sterile H2O or 50 ng/g DT was administered ip on days −2, −1, 1, 3, & 5, and either rat anti-mouse IL-2 (S4B6-1) or rat IgG2a isotype (JES3-19F) was delivered ip daily (day −2 through day 6). Colonic LPLs from each mouse were harvested on day 7. Cells were stimulated ex vivo, followed by ICS. Representative dot plots show viable CD3+ CD4+ Foxp3- LPLs from 1 mouse per group. aIL-2, anti-mouse IL-2.
B) Aggregate data from 2-3 mice per group showing percentage of viable CD3+ CD4+ Foxp3- LPLs that are IL-17A+. Each symbol represents one B6.Foxp3DTR mouse, and error bars represent 1 standard deviation from the mean in each direction. Isotype-treated animals were not different from untreated animals, so these two animal groups were combined.
C) Tissue for RNA isolation was taken from the middle colon from each mouse in Figure 5B and Taqman qRT-PCR was performed for IL-17A. ^Ct was calculated by subtracting Ct of Gapdh from Ct of IL-17A and averaging 2 technical replicates. Each symbol represents one mouse, and error bars represent 1 standard deviation from the mean in each direction.
D) 6-12 B6.Foxp3DTR mice per group were inoculated with ETBF on day 0. Either 150 μl purified sterile H2O or 50 ng/g DT was administered ip on days −2, −1, 1, 3, & 5. Colonic LPLs from 1-3 mice per group were harvested on day 7 for fluorescence-associated cell sorting. Effector T cells (CD11b-, Foxp3-, CD4+ or CD8+) were sorted from Treg-depleted mice (****, +DT) and from Treg-sufficient mice ((, No DT). RNA was isolated from Trizol and Taqman qRT-PCR was performed for indicated genes. Gapdh was used as housekeeping control for total RNA quantity (^Ct), and average of 2 technical replicates were used for each sample. CD4+ Foxp3+ Tregs were sorted from Treg-sufficient mice as the reference sample for calculating ^^Ct. Fold change = 2^-(^^Ct). Each symbol represents one mouse (or pooled group), and error bars represent 1 standard deviation from the mean in each direction. Holm-Sidak method for multiple comparisons was used to compare No DT vs + DT groups.
E) B6.Foxp3DTRxMin mice were inoculated with ETBF on day 0. Either 150 μl purified sterile H2O or 50 ng/g DT was administered ip on days −1, 0, 1, 3, and every other day until sacrifice and harvest. Either rat anti-mouse IL-2 (S4B6-1) or rat IgG2a isotype (JES3-19F) was delivered ip daily (day −1 through day 13). Colons were harvested on day 13, cleaned, rolled, and fixed in 10% formalin for histology & scoring. Microadenomas were counted per colon and include 2 separate experiments with 3-12 mice per group per experiment. DT animals treated with isotype Ab (N=10) were not different from DT only-treated animals (N=18), so DT animals treated with or without isotype Ab were combined. Each symbol represents one mouse, and error bars represent 1 standard deviation from the mean in each direction. IFNγ−/− × Min + DT microadenoma counts from Figure 3D are also shown for easier side-by-side comparison.
F) Inflammation scores per colon in (E).

