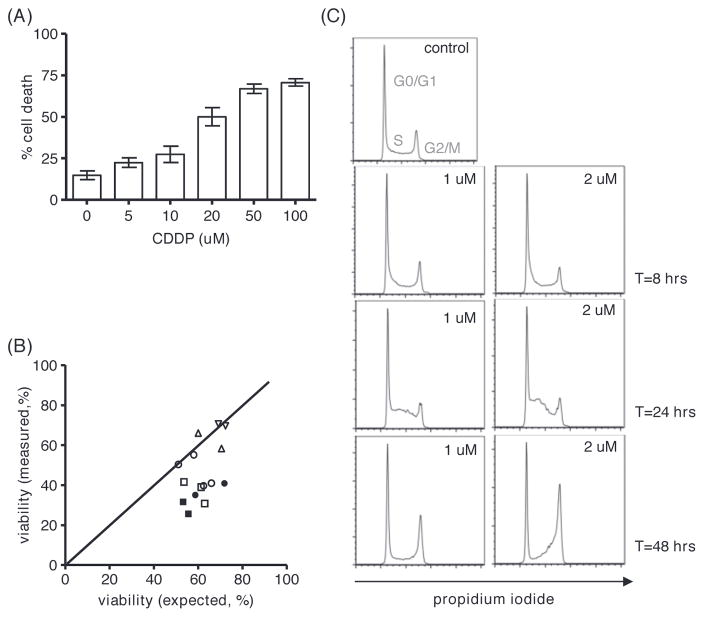
Figure 2.
Functional consequences of treatment of MEC1 cells with CDDP. (A) Apoptosis after 48 h of treatment with increasing doses of CDDP as indicated assessed by MitoTracker staining; mean ± SEM of three experiments. (B) Viability of MEC1 cells after treatment with CDDP (5 μM open symbols; 10 μM solid symbols) and F-ara-A (▾ 5 μM, ▴ 10 μM, ●; 25 μM, ▪ 50 μM). Measured viability is plotted against expected viability (based on activity of the separate drugs; see “Materials and methods” section); the area below the diagonal represents synergism. (C) Analysis of cell cycle transition by propidium iodide (PI) staining after 8, 24 and 48 h of CDDP treatment in doses as indicated.

