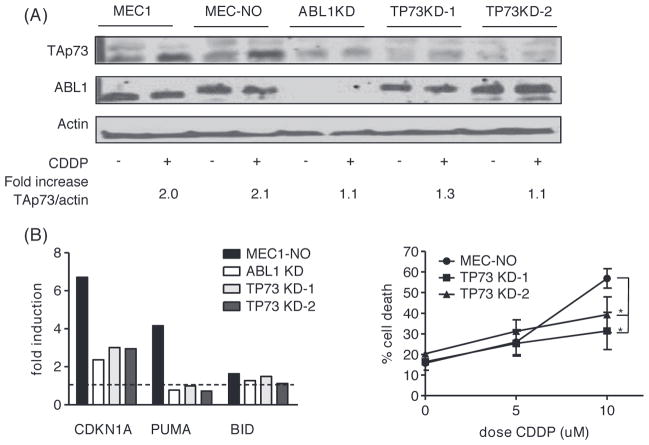
Figure 4.
Knockdown of ABL1 or TP73 in MEC1 cells. (A) Protein levels of ABL1 and TAp73 analyzed by Western blot upon 48 h of treatment with 10 μM CDDP as indicated after lentiviral transduction of MEC1 cells with a shRNA targeting ABL1 or TP73 (two constructs) or a non-targeting shRNA. (B) mRNA expression levels, assessed by qRT-PCR, of CDKN1A, PUMA and BID upon treatment of lentiviral transduced MEC1 cells with CDDP 10 μM for 48 h. Plotted is fold induction compared to untreated cells; dotted line represents “no induction” (fold induction = 1). (C) Apoptosis after 48 h of treatment with CDDP as indicated, assessed by MitoTracker staining; mean ± SEM of three experiments. MEC-NO = MEC1 cell transduced with nonsense shRNA; *p < 0.05 (paired t-test).

