
Figure 3.
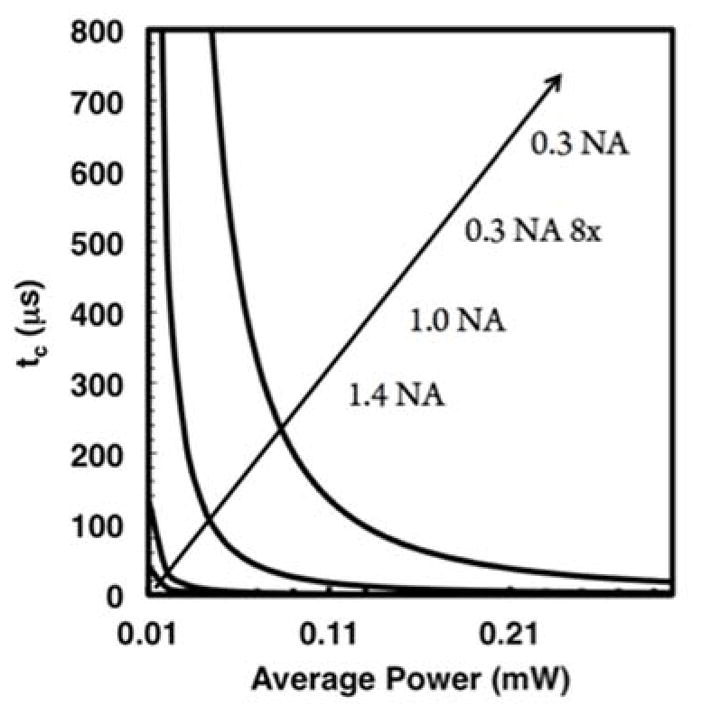
Theoretical plots of critical exposure time versus power with curves representing lenses of several common numerical apertures. The critical exposure time decreases dramatically for a given power as the numerical aperture increases. The numerical aperture of the lenses are shown offset from the curves with the 0.3 NA 8× curve representing the effective light dose a 1 μm plane receives when scanned by a 0.3 NA objective lens, given the 8 μm z-resolution.