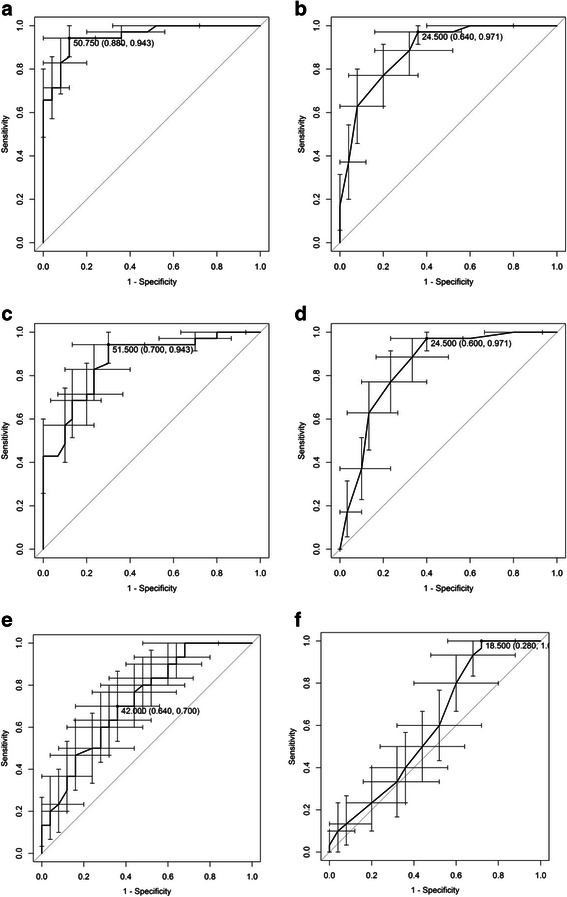
Fig. 2.

Bootstrapped ROC curves with 95 % confidence intervals demonstrating sensitivities and specificities of (a) Qmci-D and (b) SMMSE-D in differentiating dementia from normal cognition, the (c) Qmci-D and (d) SMMSE-D in differentiating MCI from normal cognition, and the (e) Qmci-D and (f) SMMSE-D in differentiating MCI from dementia
