Fig. 2.

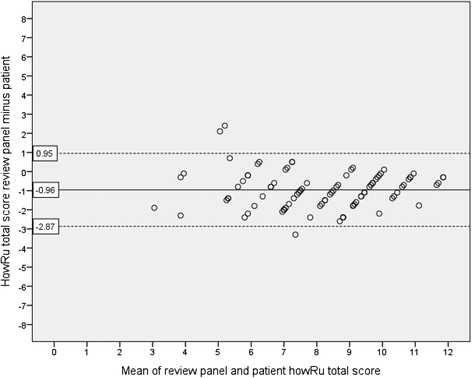
Bland-Altman plot showing the relationship between the howRu total scores of patients and the review panel. The dashed lines represent the limits of agreement

Bland-Altman plot showing the relationship between the howRu total scores of patients and the review panel. The dashed lines represent the limits of agreement