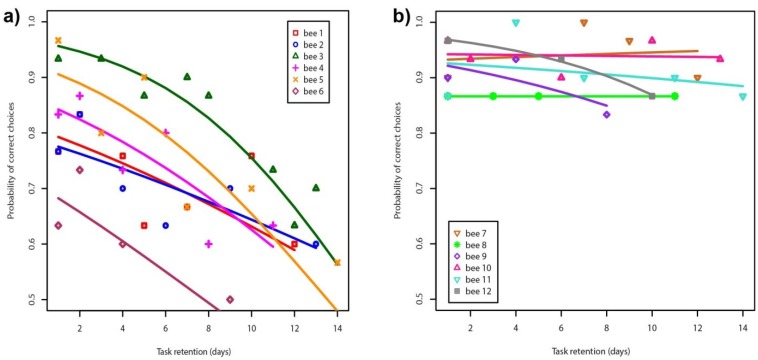
Figure 2.
Probability of correct choices for a total of 12 bees performing a hard colour discrimination task (panel a, n = 6) and an easy discrimination task (panel b, n = 6) tested on different days during two weeks. Solid lines represent a logistic regression model fitted to the data corresponding to each individual bee.

