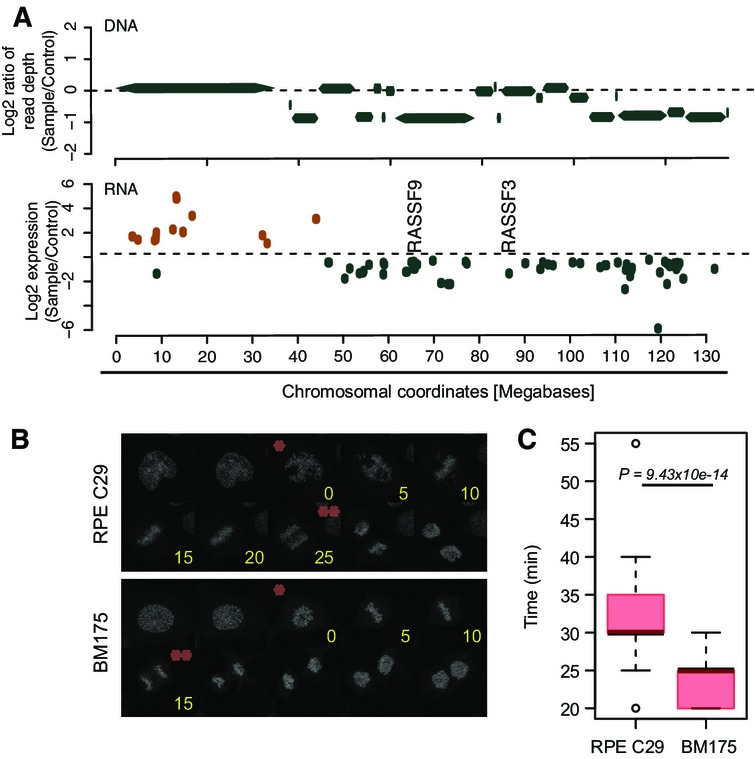
Figure 5.

Transcriptional consequences of chromothripsis in BM178 and BM175
- Differentially expressed genes on the chromothripsis-affected chromosome 12 of BM178, compared to its parental line C29 (FDR = 10%). Log2-fold changes of differentially expressed genes are depicted. The above panel shows segmented DNA copy number for this chromosome. Orange, upregulated. Green, downregulated.
- Mitotic progression analysis consistent with downregulation of BUBR1 and CASC5 on the chromothripsis-affected chromosome 15 in BM175. Histone H2B was constitutively tagged with red fluorescent protein mCherry to visualize chromatin in BM175 and C29. Exemplary images of live cell experiments are shown. Asterisks indicate chromosome condensation (*) and segregation (**) time points. Time is indicated in minutes (yellow).
- Timing from chromosome condensation to chromosome segregation (quantification of data in (B)) was plotted for dividing cells of C29 (n = 54) and BM175 (n = 33; P-value based on Welch two-sample t-test). Box-and-whiskers plots: boxes show the upper and lower quartiles (25–75%) with a line at the median, whiskers extend from the 10 to the 90 percentile and dots correspond to the outliers.
