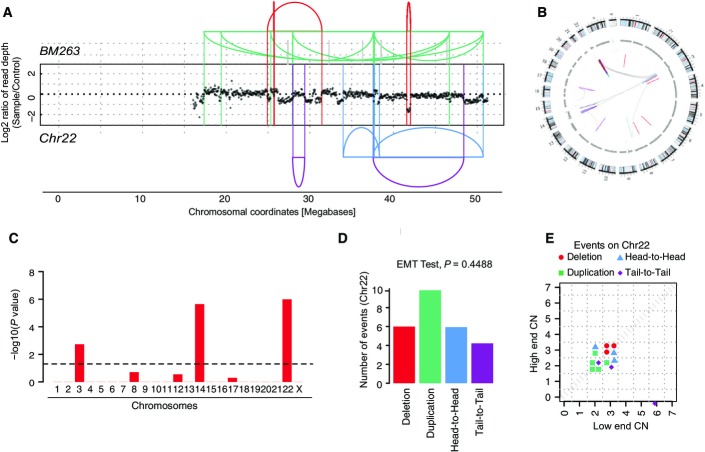
Figure EV3.
Further evidence for chromothripsis in TRF2-depleted cells
- DNA alteration patterns of chromosome 22 in BM263 based on mate-pair data. Highly oscillating copy number profiles are consistent with the occurrence of chromothripsis. SRs are color-coded: red, deletion type (T-H); green, duplication type (H-T); blue, head-to-head (H-H) type; purple, tail-to-tail (T-T) type; gray, inter-chromosomal.
- Circos plot depicting inter- and intra-chromosomal connections in BM263.
- Statistically significant deviation from null hypothesis of no breakpoint clustering in BM263 (y-axis depicts -log10(P-value) for KS test applied to each chromosome), in line with the occurrence of chromothripsis.
- Randomness of DNA fragment joins for BM263, additionally supporting the occurrence of chromothripsis. P-value derived from multinomial testing against null hypothesis “equal distribution of joins.”
- Copy number jump distribution between joined fragments of chromosomes undergoing chromothripsis (displayed for segments with confident copy number ascertainment). On chromosome 22 in BM263, chromothripsis occurred most likely in isolation.

