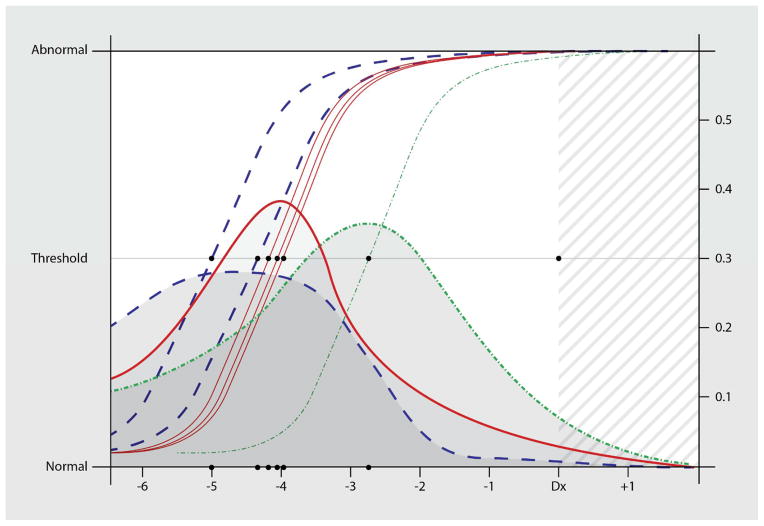
Figure 1.
Logistic curves (left-side Y-axis scale) represent the predicted clinical thresholds for decline on each of the subtests sensitive to disease onset. These thresholds are the models’ average departure from the stable state to the active disease state in participants who eventually develop PDD. They are derived from the probability densities (right-side Y-axis scale) which represent the cumulative distributions of these models’ estimated time-of- onset for the active disease state (changepoint). In this figure we have convolved the subtests’ distributions to indicate the 3 proposed epochs. These epochs are based on our previous longitudinal factor analysis using this sample. Standard errors reflect the sensitivity/specificity of the subtests to detect change (slope of the logistic curves measured at the threshold).
-
(a)Digit Span - Backwards Subtest of the WMS
-
(b)Mental Control Subtest of the WMS
-
(c)Digit Symbol Substitution Subtest of the WMS
-
(d)Block Design Subtest of the WAIS
-
(e)Benton Visual Retention Test – Copy
-
(f)Information Subtest of the WMS
- α, β1, β2 ~ N (0,1000)
- δi ~ N(μi, τi)
- μi ~ N (0,1000) < 0
- τi ~ Gamma (0.001,0.001)

