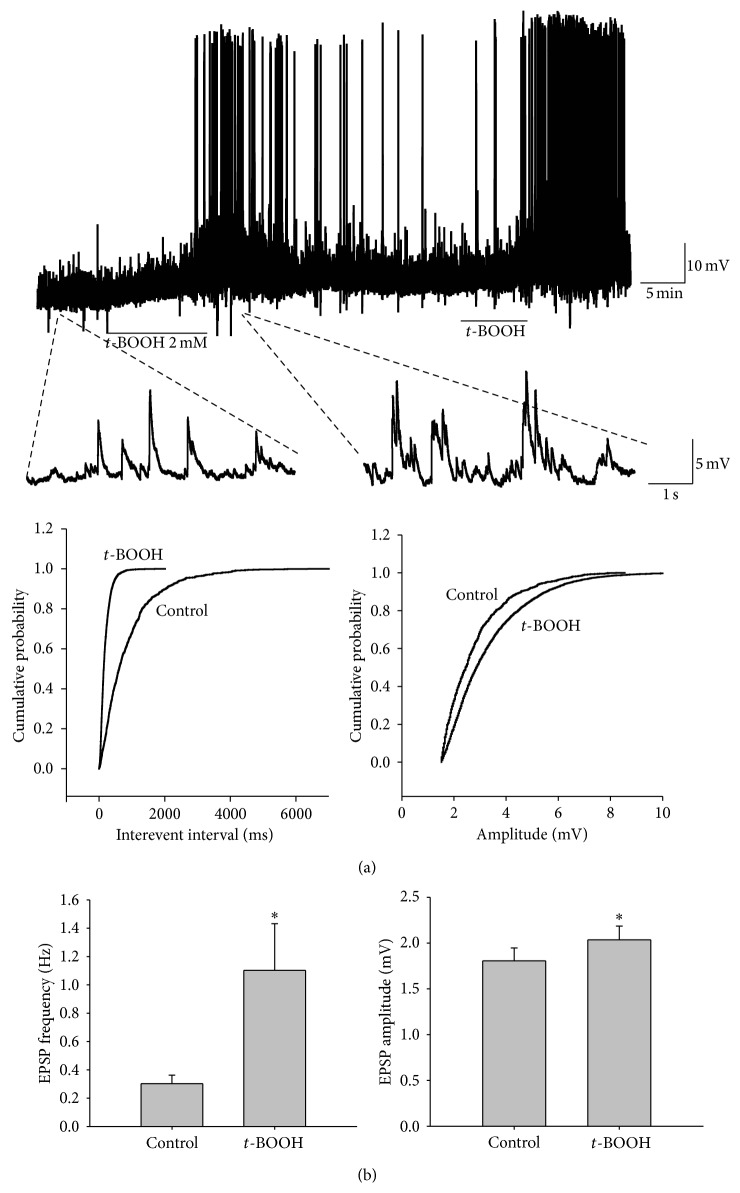
Figure 3.
Effects of t-BOOH on membrane potential and EPSP in a patch clamp recording of SG neurons. (a) Original amplitude traces of EPSP in an SG neuron show that t-BOOH (2 mM, 7 min) increased the amplitude and frequency of EPSPs. The lower traces show EPSP at an expanded time scale. Normalized cumulative distribution analysis of EPSP amplitude and frequency (lower panels) showed that t-BOOH caused a significant shift toward higher frequency (left) and amplitude (right) in the neuron. (b) Average EPSP frequency (left) and amplitude (right). After application of t-BOOH, both the frequency and the amplitude increased significantly (P < 0.05, asterisks) from pre-t-BOOH levels as determined by a paired t-test. The data are mean with standard errors of the mean.

