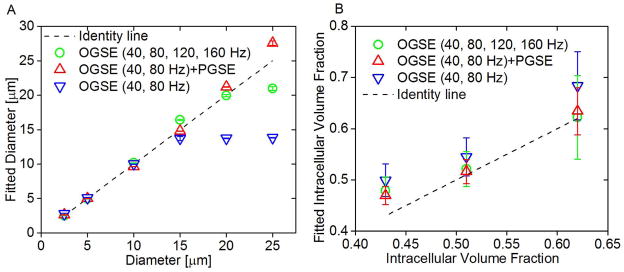
Figure 2.

(A) Correlation between fitted diameters and preset diameters in simulations. Fitted diameters generated from three different combinations of OGSE and PGSE signals, mean ± std (n=3, with three different intracellular volume fractions: 43%, 51%, and 62%) vs. preset diameters. The dot line represents the identity line. (B) Fitted intracellular volume fraction generated from three different combinations of OGSE and PGSE signals, mean ± std (n=6, with cell size ranging from 2.5 to 25 μm) vs. preset intracellular volume fractions. The dot line represents the identity line.
