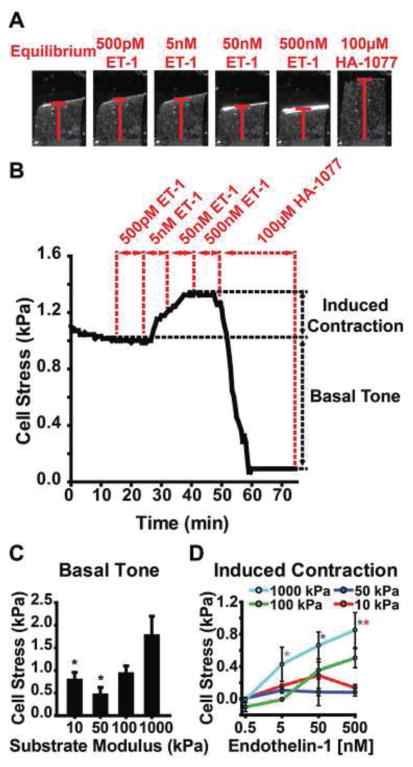
Figure 5.
VSMC functional contractility increases with increasing substrate modulus. A. Bright field images show corresponding time points of variable modulus vMTF film. Red bar indicates film projection length. B. Representative temporal stress curve for 50kPa film. C. Basal tone for varying substrate moduli. Mean±SEM (n = 18, 12, 21, 20, respectively) p<0.05 compared to 1000kPa. D. Induced contractility for varying substrate moduli. Mean±SEM (n = 18, 13, 17, 14 [n = 20, 13, 21, 20], respectively [n for 50nM]). Significant with respect to substrate modulus with matching asterix color (p<0.05).

