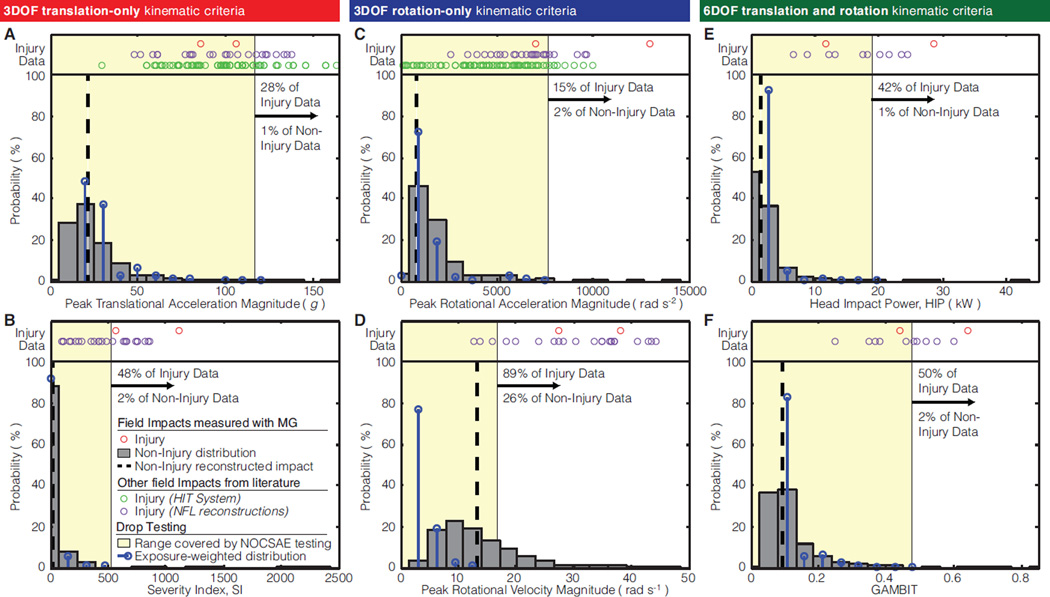
Figure 3. Aggregate distributions of kinematic criteria.
Field data for six kinematic criteria is plotted against the range of values produced by the highest drop heights in the NOCSAE standard protocol on the twin-wire drop test (yellow region) and exposure-weighted distribution of drop test data (black bars). We also compared the range covered by NOCSAE to 116 mTBI impacts recorded in previous studies: n = 2 using our instrumented mouthguards (red circles) (Hernandez et al., 2014), n = 89 using the Head Impact Telemetry System (HITS) (green circles) (Broglio et al., 2011; Duma and Rowson, 2009; Guskiewicz et al., 2007; Rowson et al., 2012), and n = 25 using NFL reconstructions (purple circles) (Newman et al., 2000a,b; Pellman et al., 2003).

