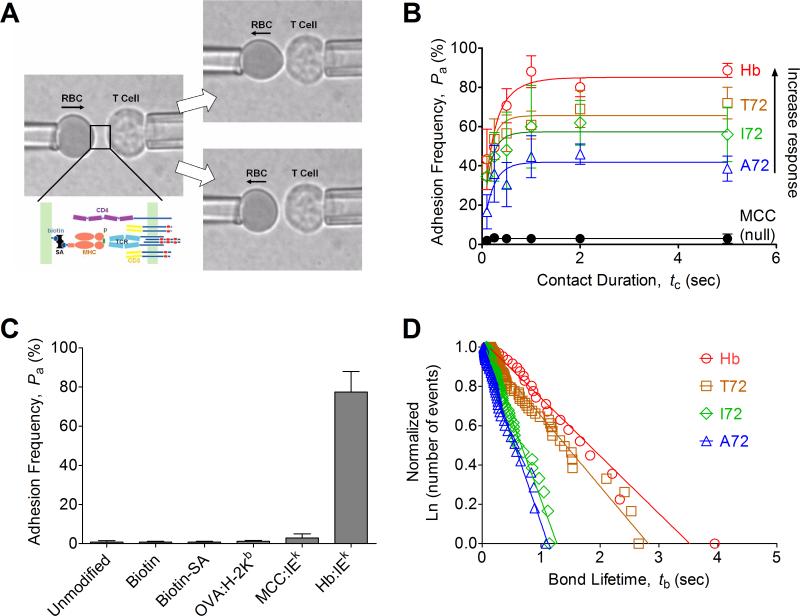
FIGURE 1. Micropipette adhesion frequency assay and thermal fluctuation assay.
(A) Schematic of micropipette apparatus. A T-cell and a pMHC-coated RBC are held by two apposing micropipettes before the contact. Below the left photomicrograph, the TCR complex and CD4 are drawn on the T-cell surface, whereas the pMHC coupled via biotin–streptavidin interaction are drawn on the RBC surface. The RBC was brought to contact the T-cell for certain contact duration and retract to observe the presence, signified by the elongation (upper right), or absence, signified by the lack of elongation (lower right), of the soft RBC membrane at the end of the contact. (B) The adhesion frequency assay was conducted for a panel of cognate peptides (Hb, T72, I72, A72) and an irrelevant peptide (MCC) with representative data (from three independent experiments) shown along with the following molecule densities (TCR:pMHC in molecules/μm2): Hb (185:33), T72 (179:67), I72 (171:114), A72 (158:186), and MCC (136: 4483, 315 for CD4). Each point represents mean ± SEM (n=3-5 cell pairs each contacted 50 times to estimate an adhesion frequency) (C) Controls for nonspecific adhesion were performed at 5s contact duration between 3.L2 T cell and unmodified RBCs, biotinylated RBCs without further coupling to streptavidin, biotinylated RBCs linked with streptavidin without further coating of pMHC, biotinylated RBCs linked with streptavidin coated with pMHC-I (OVA:H-2Kb) or noncognate pMHC-II (MCC:I-Ek), which were compared to biotinylated RBCs linked to streptavidin coated with cognate pMHC-II (Hb:I-Ek). Each bar is presented as mean ± SEM (n=5 cell pairs each contacted 50 times to estimate an adhesion frequency). (D) The thermal fluctuation assay was performed as described in Methods. Ranked bond lifetime distributions for each ligand were linearized by ln(# of events with a lifetime > tb)/ln(total # of events) versus tb plots to allow us to estimate koff from the negative slope of the line. The numbers of bond lifetimes are 22 (Hb), 66 (T72), 65 (I72), and 46 (A72). The high levels of goodness-of-fit as assessed by R2 (> 0.97 for all ligands) support the use of the first order kinetics model.

