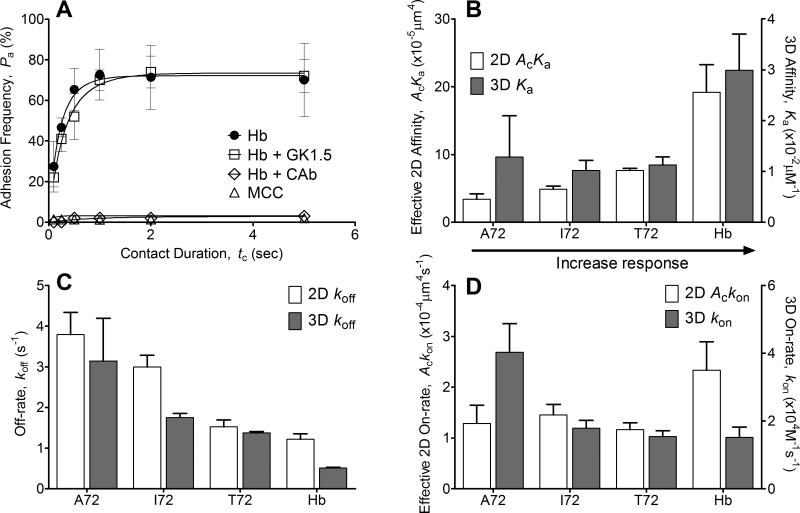
FIGURE 2. Comparison of 2D binding parameters with 3D counterparts.
(A) Lack of CD4 binding to I-Ek. Treatment with the TCR blocking antibody CAb abolished the adhesion frequency observed without blocking, but treatment with the CD4 blocking antibody (GK1.5) did not affect the binding curve. The noncognate ligand MCC:I-Ek had some binding at a longer contact duration (5s) with a very high site density of >4,000 molecules/μm2, but overall binding was very low (<5%). The molecule densities used to generate these representative data are (TCR:pMHC molecules/μm2): Hb (116:34), Hb + GK1.5 (116:34), Hb + CAb (163:28), and MCC (136:4483, 315 for CD4). Each point represents mean ± SEM (n≥3 cell pairs each contacted 50 times to estimate an adhesion frequency). (B-D) Comparison between 2D vs. 3D affinity (B), off-rate (C), and on-rate (D). 2D measurements were from adhesion frequency assay and thermal fluctuation assay whereas 3D measurements were from SPR. Each 2D kinetic parameter is presented as mean ± SEM (n≥3 sets of adhesion frequency vs. contact time curve).

