

Abstract
Mechanical stimulation of cell cultures has been shown be an effective means of enhancing ECM production. ECM produced from vocal fold fibroblast cultures has the potential for therapeutic use for vocal fold repair. However, current bioreactor designs generally fail to produce physiological relevant frequency and strain values. Here we present an approach for using commercial oscillatory rheometers and an elastic ring bilayer system to produce physiologically relevant strain values at frequencies in the range of 20 – 100HZ. We demonstrate the ability to target specific strain and frequency values by manipulating system parameters, and also show that it is possible to maintain high oscillatory strains for extended periods of time. Such a system could be used to mechanically stimulate cell cultures contained within gel carrier systems and has the potential to be extended to other applications requiring high strains at low frequencies.
Keywords: Elastic modulus, Viscous modulus, Rheometry, Resonance Frequency
Introduction
Cell-derived extracellular matrix (ECM) has therapeutic potential for the treatment of vocal fold injury. Collection of ECM may be accomplished by culturing cells in vitro. Ideally, ECM would exhibit properties similar to native vocal fold tissue. Physiologically relevant mechanical stimulation of cell cultures may provide a way to influence ECM properties to more closely match those of native ECM, and has been shown to be an effective way of enhancing ECM production (Chiquet et al., 2003). However, previous research using bioreactors to mimic the mechanical properties of the vocal fold have used synthetic scaffolding as a cell carrier (Gaston et al., 2012; Titze et al., 2004a; Wolchok et al., 2009). Such materials may lack the ability to safely degrade in the body and may, even if they are resorbable, cause an inflammatory reaction when implanted. Therefore, methods of mechanically stimulating cultures using more natural materials, such as hyaluronic acid (HA) gels, as cell carriers may offer greater therapeutic potential. Modifications made to standard commercial rheometer setups may allow for the stimulation of such cultures.
While there are several methods which may be employed to measure the biomechanical properties of the vocal fold (Miri, 2014), rheometry is the common method used to measure frequency dependent viscoelastic properties. Oscillatory tissue deformation in a torsional rheometer is facilitated by the elastic component of the tissue by providing a restoring force to assist the motor in periodic acceleration and deceleration. A mechanical resonance between motor-shaft inertia and material elasticity can also be exploited (Titze et al., 2004b), in which large strains can be achieved in rheometers designed for only small strain applications.
The elastic properties of most materials are sufficient for achieving high strains, even when the amount of torque available is small (Klemuk et al., 2008). However, when investigating more fluid or gel-like materials for vocal fold applications, previous results using commercial rheometers have shown a limited ability to achieve large strains (above ~20%) or high frequencies (above 20Hz) (Chan et al., 2001; Chan and Titze, 1998; Kutty and Webb, 2009). This limitation currently presents an obstacle for stimulation of cells under physiological conditions using rheometers.
Here we describe an adaptation to exploit resonance between a secondary material and the inertia of the motor-shaft assembly such that large strains and high frequencies can be achieved with primary materials whose lack of a restoring force would normally prevent such operations. The application of this adaptation may provide a means to use standard rheometer setups in a bioreactor role to mechanically stimulate cell cultures.
Calculation and Control of Resonance Frequency
Given that rheometer motor-shaft assemblies are usually designed to have negligible stiffness between plates under no-load conditions, a mechanical resonance frequency occurs only when the test material between the plates has stiffness. Since this material stiffness is generally unknown (it is the object of measurement), the resonance frequency is not under direct control. However, by adding an elastic material of known properties to create a concentric bilayer system, a predictable resonance frequency can be created.
Figure 1 shows a concentric bilayer system consisting of an inner material with shear properties G1′ and G1″ surrounded by an elastic ring with shear properties G2′ and G2″. If both materials adhere to the plates, the torque (T) developed by the material at the top plate boundary is
Figure 1.

Schematic of concentric bilayer system. Subscipt 1 denotes the inner material of unknown properties, while subscript 2 denotes the elastic material of known properties.
| (1) |
where τθz is the shear stress on the top surface, dA is a differential ring area, r is the radius to the differential ring area, and r1 and r2 are the radii of the inner and outer materials respectively. For linear viscoelasticity under sinusoidal displacement θ and a gap d between the plates, the complex stress-strain relation is (Macosko, 1994)
| (2) |
and the differential area is
| (3) |
Substituting these quantities into Equation 1 yields the complex torque
| (4) |
After evaluating the integrals,
| (5) |
| (6) |
where equivalent single-layer elastic and viscous shear moduli are defined as
| (7) |
| (8) |
Note that if r1 = 0, the outer ring becomes a full disk with G′ = G2′ and G″ = G2″. At the other extreme, if r1 = r2, G′ = G1′ and G″ = G1″.
The equation of motion for the rheometer system includes the inertia I,
| (9) |
where T̄0 is the torque applied by the motor, I is the moment of inertia of the motor-shaft-plate combination, and ω is the angular frequency of the plate. The frequency response of the system is taken to be the ratio of the angular displacement, θ, to the applied torque,
| (10) |
A resonance frequency occurs when the first two terms in the denominator cancel each other, which leads to
| (11) |
All variables in this equation are known except G′. However, if in Equation (7), then all variables are known and the resonance frequency becomes
| (12) |
Theoretical Response Curves
For conditioning of cell systems for vocal fold repair, shear strains in the range of 0.1 – 0.5 are desirable (Titze et al., 2003). Given that strain varies radially in the material, a convention has been established to choose the 75% value of the sample radius as a representative strain for the test material (Macosko, 1994). Thus, if
| (13) |
the strain response from Equation (10) can be written as
| (14) |
where ω0 = 2π f0.
Figure 2 shows theoretical response curves for strain γ when d, r1, G2′, and G2″/G2′ are varied. The nominal parameter values selected were I = 3.5E-05kg-m2, r1 = 15mm, r2 = 30mm, d = 1.5mm, G1′ = 1kPa, G1″ = 1kPa, G2′ = 30kPa, and G2″/G2′ = 0.15. With these values, the predicted resonance frequency is 132Hz and the maximum achievable strain is 0.31 for 0.15N-m of torque.
Figure 2.
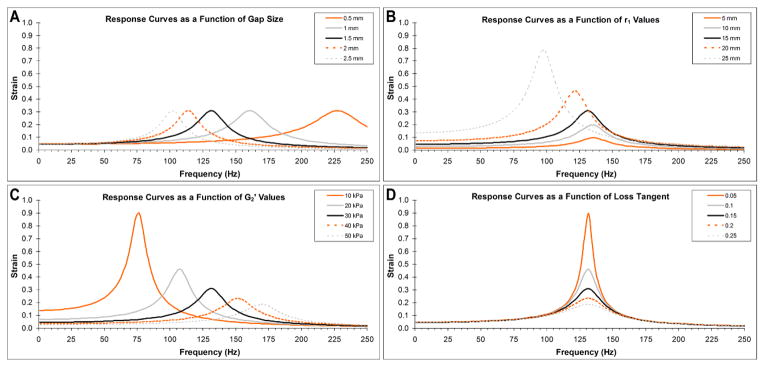
Theoretical response curves evaluated at varying gap distances (A), inner ring radiuses (B), ring elastic moduli (C), and ring loss tangents (D), holding all other parameters constant. Theoretical results indicate the resonance frequency can be independently modified by changing the gap distance between plates, while strain magnitude can be independently modified by changing the ring loss tangent. Modification of ring elastic modulus or inner ring radius affects both the resonance frequency and the maximum attainable strain.
Two results are noteworthy; namely that maximum strain is independent of gap size (Figure 2A), and that resonance frequency is independent of the loss tangent of the outer ring material (Figure 2D). Thus, these two parameters can be used independently to set resonance frequency and maximum achievable strain respectively. Changing r1 and G2′ affects both maximum attainable strain and resonance frequency simultaneously and in opposite directions.
Ring Fabrication
Elastic rings were created using medical grade polyurethane (PU) (Tecoflex SG-80A, Lubrizol, Wickliffe, OH). A mixture of 10% w/v PU was made by dissolving PU pellets in N′N′-dimethylacetamide (Sigma-Aldrich, St. Louis, MO) overnight at 60°C. Custom molds (60mm radius, 1.5mm depth) were packed with table salt, filled with the PU solution, and placed in a distilled water bath overnight, which both precipitated the PU solution and dissolved the salt. The result is a highly porous and flexible PU disc. Discs were rinsed in distilled water for 48 hours to remove any residual salt or solvent, frozen to −80°C, and lyophilized.
Discs were sectioned into rings using a rigid template. Each ring was 1.5mm thick with an inner radius of 43mm and an outer radius of 60mm. For testing, each ring was placed between sand paper adhered to the bottom plate and a custom fabricated Delrin 60mm upper plate containing through-holes for sample loading (Figure 3).
Figure 3.

Image of testing apparatus and PU rings. A) View of the bottom of the Delrin 60mm parrallel plate used in these experiments (top). Through holes were incorporated into the plate to reduce inertia and provide a means of sample loading. PU discs were cut into rings (bottom) for testing. B) Image of test set up with the PU ring compressed between the Delrin upper plate and sandpaper which has been adhered to the bottom plate. Sample loading can be accomplished through a needle and syringe.
Validation of Predicted Response Curves
For mathematical modeling, values of G2′ and G2″ as a function of frequency were first obtained from full discs from 1 to 200Hz (data not shown). PU rings were then tested using various input parameters (Table 1) and compared to modeling predictions. The following values remained static across all experiments: r1 = 43mm; r2 = 60mm; G1′ = 0Pa; G1″ = 0Pa; and I = 1.752E-05kg-m2.
Table 1.
Parameters used in each experiment.
| Experiment Number | Gap Size (mm) | Applied Shear Stress (Pa) |
|---|---|---|
| 1 | 0.5 | 500 |
| 2 | 1.0 | 500 |
| 3 | 1.5 | 500 |
| 4 | 1.0 | 100 |
| 5 | 1.0 | 300 |
Measured response curves generally followed modeled curves (Figure 4), although experimental curves tended to have higher area under the curve values (greater resonance bandwidth). No experimental curves were statistically different than modeled curves when compared using a two-sample K-S test (p<0.05) with the exception of the 0.5mm gap curve. Percent differences in resonance frequency, peak strain, and area under the curve for each experiment are listed in Table 2.
Figure 4.

Measured and predicted response curves using PU rings. A) Response curves as a function of gap size between the top and bottom plates. The location of the resonance frequency and amplitude of the peak strian values were all within 5% of predicted values. However, a broader curve in the measured data compared with predicted data led to large differences in area under the curve and a statistically significant difference between the measured and predicted data for the 0.5mm gap size curve. B) Response curves as a function of applied shear stress. Resonance frequency locations were within 5% of predicted values for the 300 and 500Pa groups, and within 10% for the 100Pa group. Peak strain values were all within 2% of predicted values. Similar to gap size respsponse curves, measured curves were broader than predicted curves, leading to large differences in area under the curve, although no curves were significantly different than predicted curves. Observed resonance frequency shifts to lower frequencies at higher strains are due to decreasing G2′ values as strain increases.
Table 2.
Differences in experimental verse modeled response parameters. Differences in resonance frequency, peak strain, and area under the curve are reported as percent deviation from predicted values.
| Experiment Number | Deviation from Predicted Parameters | ||
|---|---|---|---|
| Resonance Frequency | Peak Strain | Area Under the Curve (1–200 Hz) | |
| 1 | 4.1% | 4.6% | 36.7% |
| 2 | −4.5% | 1.7% | 38.8% |
| 3 | 1.0% | −0.3% | 24.9% |
| 4 | 9.6% | −0.3% | 26.2% |
| 5 | 1.0% | −1.9% | 31.2% |
Bilayer System using HA Gel
To validate the ability of PU rings to function as an elastic restoring force in a bilayer system, HA (Glycosil®, ESI BIO, Alameda, CA) was placed inside PU rings and the system tested using a 0.5mm gap and 500Pa of applied shear stress. Mathematical predictions of the response curve were made using G2′ and G2″ values previously obtained and G1′ and G1″ values obtained from testing of HA using a 20mm parallel plate in the linear region and extracting values out to 200Hz. Differences between measured and predicted resonance frequency were considerably larger (−15.9%) than those observed with just the ring, while the difference in predicted peak strain was still quite low (1.6%) (Figure 5A). As with the empty rings, differences in area under the curve were also quite large (40.3%), leading to a significant difference between the measured and predicted curve (p<0.05).
Figure 5.

A) Measured and predicted response curves for HA/ring bilayer system. Modeling failed to accurately predict the resonance frequency for this more complex system, although peak strain predictions were still very accurate (within 2%). The shift in measured resonance frequency to the left of the predicted frequency is likely due to shear thinning, and subsequent decreases in stiffness, of the HA which was not accounted for in our modeling. B) Peak strain values can be maintained for long periods of time with very little deviation from the average.
The ability of the system to maintain peak strain values over moderate periods of time was also investigated. Using results previously obtained from experiments using HA/ring systems, PU rings loaded with HA were tested at the resonance frequency (65Hz) for 10min. Bilayer systems maintained strain values which never deviated more than 5% from the mean (mean deviation of 1.1%) over the testing period (Figure 5B).
Discussion
We have proposed here a method for achieving strains on the order of 100% at frequencies between 20 – 100 Hz using a bilayer ring system. Mathematical modeling demonstrated the flexibility of targeting desired frequencies and strains by varying the gap between plates and the properties of the polyurethane ring. Importantly, we have demonstrated the ability of our system to maintain physiologically relevant strain and frequency values. In the context of mechanical stimulation of cell cultures, this data demonstrates the potential for the use of a modified rheometer system. Although we have focused here on applications related to vocal folds, the methodology we have described may be adapted for use in a variety of systems. It should be noted that while stress is constant between the lower and upper plates in our system, strain in the depth direction is applied in a linear gradient. While this nonhomogeneous application of strain is likely to produce differences in ECM composition through the thickness of a cell culture, this may prove beneficial for in vivo applications where strain is not homogenously applied across the tissue, such as in the vocal folds.
To validate mathematical modeling, data were collected from empty discs using varying parameters and compared to predicted response curves, with the exception of response curves as a function of loss tangent. Loss tangent response curves were not able to be independently tested due to the fact that alternative materials which had varying loss tangents also had varying elastic moduli, making the contribution of loss tangent differences in the results difficult to isolate. For all other response curves, generated resonance frequencies and maximum strain values were in line with predicted values and tended to follow predicted response curve shapes. Measured response curves did have more gradual increases in stain values (greater resonance bandwidth) compared with predicted curves as the resonance frequency was approached, but this may be due to the fact that viscoelastic properties fail to maintain their linear nature as high strains are approached, something not currently accounted for in our modeling.
To validate modeling of a bilayer system, HA was placed within rings and tested. While measured peak strain values matched well with predicted values, the location of the resonance frequency was considerably lower than predicted. This is likely due to changing G′ and G″ values of the HA due to shear thinning as frequency is increased. To predict G′ and G″ values, a regression line was fit to HA viscoelastic data collected at lower frequencies and extracted out to 200Hz. However, as previously mentioned, viscoelastic properties tend to lose linearity as strain values increase. This prevents an accurate prediction of inner material elastic and viscous moduli at higher frequencies.
Mathematical modeling suggests that the bilayer system proposed here could be used to extract the viscoelastic properties of inner materials, whose properties are not known and are otherwise unattainable using standard rheometry. However, we were not able to accurately extract the viscoelastic properties of the inner material, likely due to the properties of the ring used in our system. Mathematical equations dictate that to extract properties of the inner material, the outer ring must have a viscous modulus much less than that of the inner material. However, the polyurethane used in our rings had a viscous modulus about an order of magnitude larger than the HA. Therefore, future work using a more purely elastic material for the ring should be conducted to test the hypothesis that properties of an inner material can be extracted from a bilayer system.
Acknowledgments
We would like to thank Dr. Glenn Prestwich with the Department of Medicinal Chemistry and Dr. Patrick Tresco with the Department of Bioengineering for the generous use of their lab spaces. We would also like to thank Alex Schumacher for his assistance in fabricating PU rings. Funding for this project was provided by NIH 5R01DC008612-06.
Footnotes
Conflict of Interest
The authors have no conflicts to disclose.
Publisher's Disclaimer: This is a PDF file of an unedited manuscript that has been accepted for publication. As a service to our customers we are providing this early version of the manuscript. The manuscript will undergo copyediting, typesetting, and review of the resulting proof before it is published in its final citable form. Please note that during the production process errors may be discovered which could affect the content, and all legal disclaimers that apply to the journal pertain.
References
- Chan RW, Gray SD, Titze IR. The importance of hyaluronic acid in vocal fold biomechanics. Otolaryngology--head and neck surgery : official journal of American Academy of Otolaryngology-Head and Neck Surgery. 2001;124:607–614. doi: 10.1177/019459980112400602. [DOI] [PubMed] [Google Scholar]
- Chan RW, Titze IR. Viscosities of implantable biomaterials in vocal fold augmentation surgery. The Laryngoscope. 1998;108:725–731. doi: 10.1097/00005537-199805000-00019. [DOI] [PubMed] [Google Scholar]
- Chiquet M, Renedo AS, Huber F, Fluck M. How do fibroblasts translate mechanical signals into changes in extracellular matrix production? Matrix biology : journal of the International Society for Matrix Biology. 2003;22:73–80. doi: 10.1016/s0945-053x(03)00004-0. [DOI] [PubMed] [Google Scholar]
- Gaston J, Quinchia Rios B, Bartlett R, Berchtold C, Thibeault SL. The Response of Vocal Fold Fibroblasts and Mesenchymal Stromal Cells to Vibration. PloS one. 2012;7:e30965. doi: 10.1371/journal.pone.0030965. [DOI] [PMC free article] [PubMed] [Google Scholar]
- Klemuk SA, Jaiswal S, Titze IR. Cell viability viscoelastic measurement in a rheometer used to stress and engineer tissues at low sonic frequencies. The Journal of the Acoustical Society of America. 2008;124:2330–2339. doi: 10.1121/1.2973183. [DOI] [PMC free article] [PubMed] [Google Scholar]
- Kutty JK, Webb K. Mechanomimetic hydrogels for vocal fold lamina propria regeneration. 2009;20:737–756. doi: 10.1163/156856209X426763. [DOI] [PubMed] [Google Scholar]
- Macosko CW. Rheology: Principles, Measurements, and Applications. Wiley-VCH; New York: 1994. [Google Scholar]
- Miri AK. Mechanical characterization of vocal fold tissue: a review study. 2014;28:657–667. doi: 10.1016/j.jvoice.2014.03.001. [DOI] [PubMed] [Google Scholar]
- Titze IR, Hitchcock RW, Broadhead K, Webb K, Li W, Gray SD, Tresco PA. Design and validation of a bioreactor for engineering vocal fold tissues under combined tensile and vibrational stresses. J Biomech. 2004a;37:1521–1529. doi: 10.1016/j.jbiomech.2004.01.007. [DOI] [PubMed] [Google Scholar]
- Titze IR, Klemuk SA, Gray S. Methodology for rheological testing of engineered biomaterials at low audio frequencies. The Journal of the Acoustical Society of America. 2004b;115:392–401. doi: 10.1121/1.1631941. [DOI] [PubMed] [Google Scholar]
- Titze IR, Svec JG, Popolo PS. Vocal dose measures: quantifying accumulated vibration exposure in vocal fold tissues. Journal of speech, language, and hearing research : JSLHR. 2003;46:919–932. doi: 10.1044/1092-4388(2003/072). [DOI] [PMC free article] [PubMed] [Google Scholar]
- Wolchok JC, Brokopp C, Underwood CJ, Tresco PA. The effect of bioreactor induced vibrational stimulation on extracellular matrix production from human derived fibroblasts. Biomaterials. 2009;30:327–335. doi: 10.1016/j.biomaterials.2008.08.035. [DOI] [PubMed] [Google Scholar]