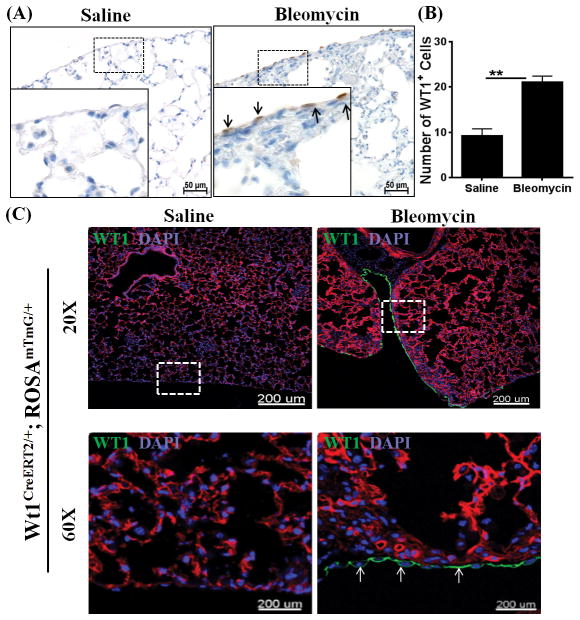
Figure 4. Wilms’ tumor 1 (WT1)-positive cells accumulate in the lungs during bleomycin-induced pulmonary fibrosis.
Bleomycin was administered via intradermal injections (100 μg/day; 5 days/week) for 4 wks and lungs were assessed for WT1-positive cells. (A) The lung sections were immunostained for WT1 antigen (brown), and the dotted box indicates the enlarged area. All images are representative of n=4 per group. Scale bar, 50 μm. (B) The number of WT1-positive cells were quantified for each lung section in bleomycin- and saline-treated control mice (n=4/group). Data shown are means ± SEM. Statistical significance between groups was measured using an unpaired Student’s t-test. *P<0.05, ***P<0.0005, ****P<0.0001 (C) WT1CreERT2/+ROSAmTmG/+ mice were injected intradermally with saline or bleomycin (100 μg/day; 5 days/wk) for 4 wks, and Cre-mediated recombination was induced by two doses of intraperitoneal Tamoxifen at Week 4 (2.5 mg/mice; Days 26–27). Images are representative of n=3 per group. The dashed box in the 20X images indicates the area highlighted in the 60X images. Scale bars, 200 μm.

