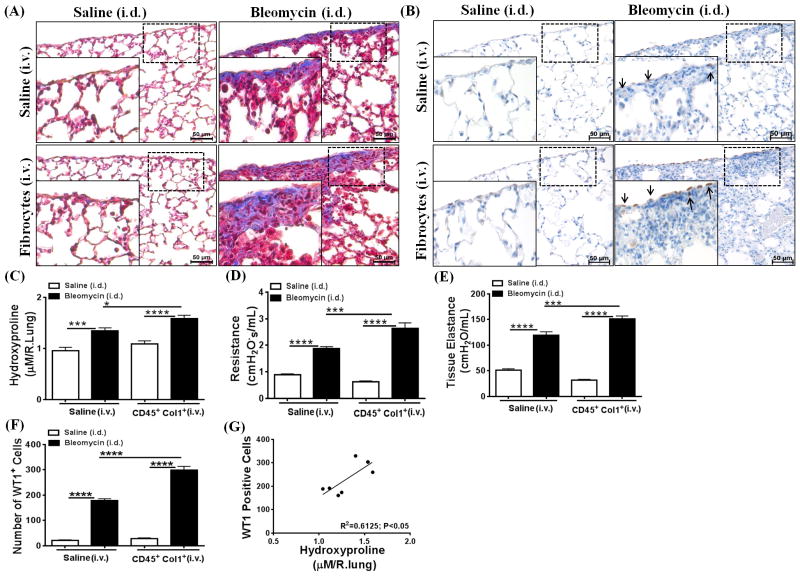
Figure 7. Adoptive cell transfer of fibrocytes augments accumulation of Wilms’ tumor 1 (WT1)-positive cells and fibrotic lung disease during bleomycin-induced pulmonary fibrosis.
FVB/NJ mice were injected intradermally with saline or bleomycin (100 μg/day; 5 days/week) for 2 wks. Mice were then infused with TGFα-induced fibrocytes isolated from mesenchymal-cell lung cultures of CCSP/TGFα mice fed doxycyclin (Dox)-treated food for 4 wks, and mice were continued on saline or bleomycin for another 2 wks. (A) Masson trichrome staining demonstrates increased collagen deposition in the subpleural areas and also interstitium of mice infused with fibrocytes and bleomycin-treated compared to saline- or bleomycin-treated mice. (B) The lung sections immunostained for WT1 antigen show increased accumulation of WT1-positive cells in the subpleural surfaces of mice infused with fibrocytes and bleomycin-treated compared to saline- or bleomycin-treated only mice. The dotted box indicates the enlarged area. (C) Total lung hydroxyproline levels were increased in mice infused with fibrocytes and bleomycin-treated compared to saline or bleomycin-treated only mice. (D) The resistance of airways was increased in mice infused with fibrocytes and bleomycin-treated compared to saline- or bleomycin-treated mice. (E) Tissue elastance was increased in mice infused with fibrocytes and bleomycin-treated compared to saline- or bleomycin-treated only mice. (F) The number of WT1-positive cells in the lung subpleura was significantly increased in mice infused with fibrocytes and bleomycin-treated compared to saline- or bleomycin-treated only mice. (G) The correlation was calculated between the number of WT1-positive cells and hydroxyproline levels of the lung using Pearson correlation coefficient with linear regression analysis (r2=0.6125; P<0.05). Data shown are means + SEM. Statistical significance was calculated using One-way ANOVA with Sidak’s multiple comparison. Data are cumulative of two independent experiments with similar results (n=6–8/group). *P<0.05, **P<0.005, ***P<0.0005, ****P<0.0001

