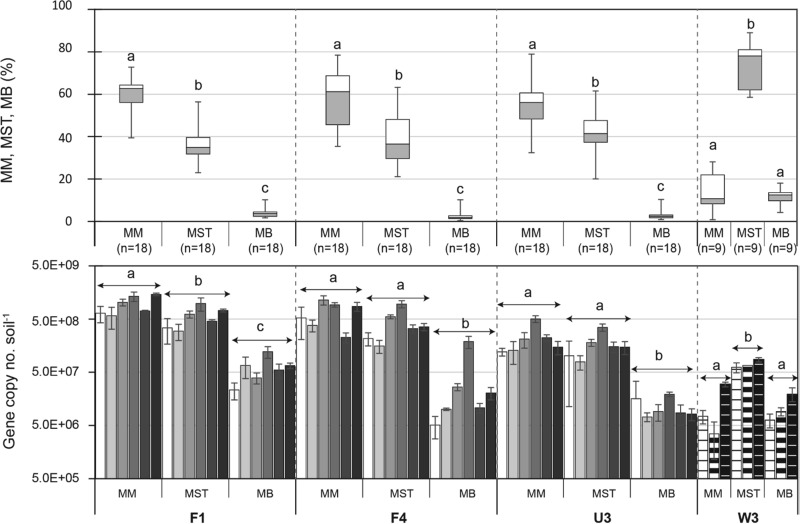
FIG 2.
Box-and-whisker plot (top) and temporal profile (bottom) of the copy numbers of mcrA from Methanomicrobiales, Methanosaeta (Methanosaetaceae), and Methanomicrobacteriaceae (Methanobacteriales) in WCA soils. Data in the temporal profile are presented in order of sampling: from the left, October 2009, April 2010, August 2011, and January, August, and December 2012 for WCA-2A sites F1, F4, and U3 and February 2012 and March and April 2013 for site W3. Error bars in the bar graph represent ±1 SE (n = 3). Box-and-whisker plots were generated from the pooled data from the temporal profile. Boxes depict the medians (horizontal lines in the boxes) and the lower and upper quartiles (bottoms and tops of the boxes, respectively). The vertical bars (whiskers) show the highest and the lowest values, excluding outliers. The different letters indicate a significant difference among the groups Methanomicrobiales, Methanosaetaceae, and Methanobacteriales (P < 0.05 by the Tukey-Kramer HSD test).

