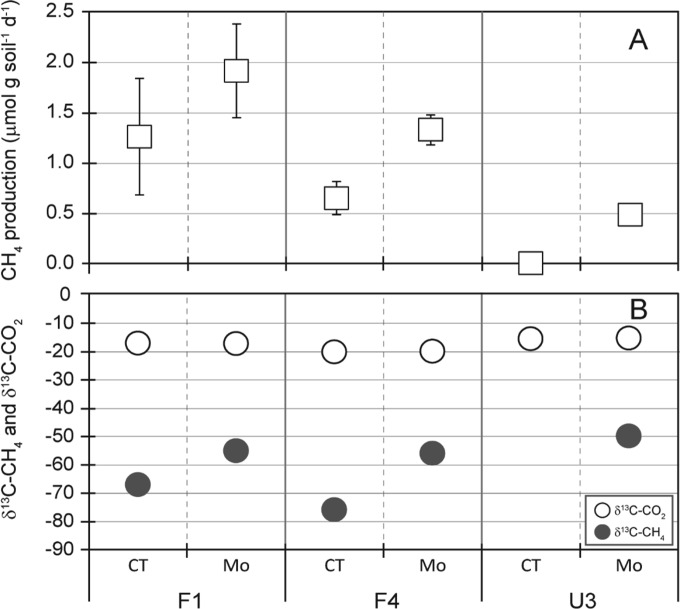
FIG 6.
CH4 production rate (A) and composition of the δ13CH4 and δ13CO2 produced (B) during incubation of soils sampled in August 2012. Error bars represent ±1 SD (n = 3; note that the control incubation of site U3 soils did not produce a detectable amount of δ13CH4). CT, control without MoO42−; Mo, addition of MoO42− (20 mM).

