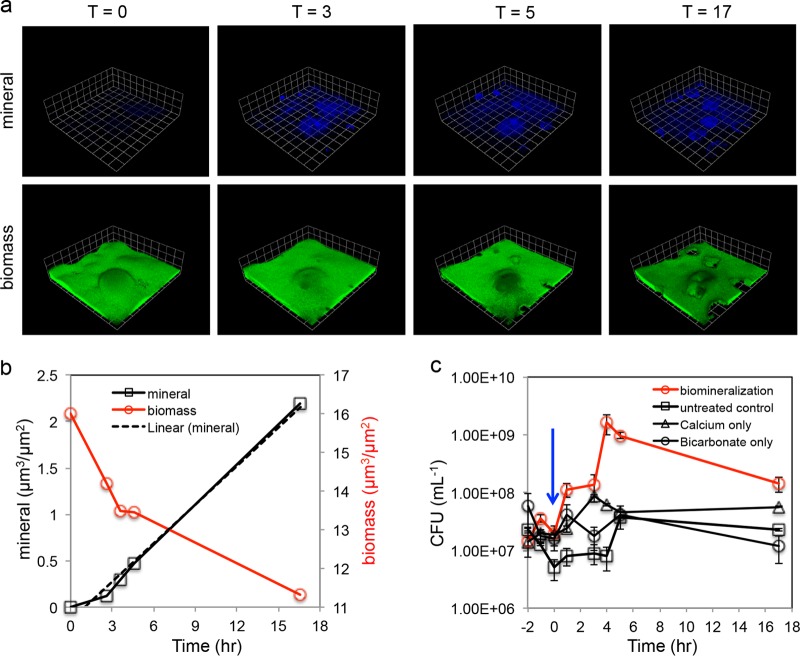
FIG 3.
(a) Time series visualization of mineral growth and biofilm morphology. The same field of view was imaged at 0, 3, 5, and 17 h. Scale grid = 23 μm. See Fig. S4 in the supplemental material for orthogonal images. (b) Quantified biomass and mineral deposits in the field of view show opposite trends during biomineralization. (c) Detachment of cells from the biofilm during biomineralization. The cell concentration in the flow cell effluent was monitored for 2 h before biomineralization. Biomineralization medium or control treatments were introduced at t0 (arrow). Cell counts in the flow cell effluent significantly increased during biomineralization, indicating that biomineralization induced detachment of cells from the biofilm. Increased cell detachment was not observed in biofilms under control conditions, including untreated biofilms and biofilms treated with 20 mM CaCl2 or 20 mM NaHCO3.

