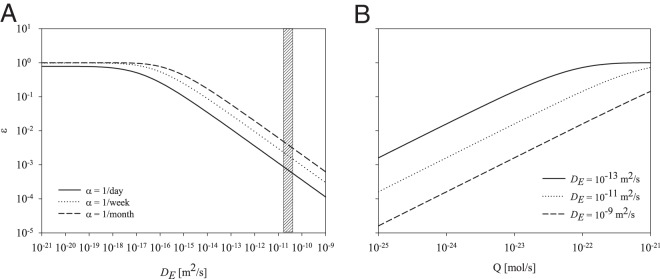
FIG 2.

(A) Effects of enzyme decay rate (α) and enzyme diffusivity (DE) on the efficiency (ε) of the enzyme. The plotted decay rates (1/1, 1/7, and 1/30 days) are based on in situ measurements (34, 41). The gain in efficiency by decreasing the enzyme decay rate is relatively small compared to what can be gained by an attached enzyme (diffusivity approaching zero). The range of the shaded area symbolizes the effect enzyme size/mass has on enzyme diffusivity based on molecular mass data collected from the literature (Table 2). The size variation (27 to 94 kDa) of the measured enzymes causes a relatively small variation in diffusivity. (B) Impacts of enzyme production (Q) and enzyme diffusivity (DE) on the efficiency of the enzyme.
