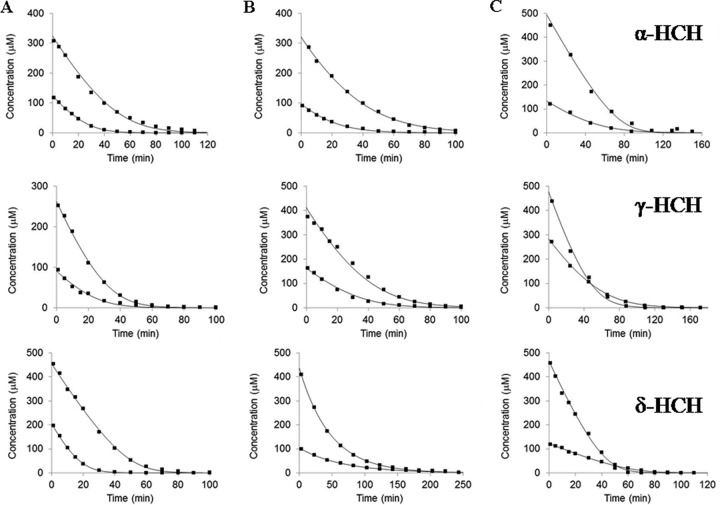
FIG 3.
Metabolism of α-HCH, γ-HCH, and δ-HCH by LinA type 1 (A), type 2 (B), and type 3 (C). In each case, two concentrations of the substrate and enzyme were used. Thus, 125 and 325 μM α-HCH were incubated with 0.74 and 1.01 μM LinA type 1, respectively; 90 and 260 μM γ-HCH were incubated with 0.201 and 0.324 μM LinA type 1, respectively; and both 205 and 455 μM δ-HCH were incubated with 5.07 μM LinA type 1. Similarly, 95 and 320 μM α-HCH were incubated with 0.53 and 0.84 μM LinA type 2, respectively; 170 and 410 μM γ-HCH were incubated with 1.38 and 2.97 μM LinA type 2, respectively; and 105 and 435 μM δ-HCH were incubated with 36 and 91 μM LinA type 2, respectively. Likewise, 130 and 495 μM α-HCH were incubated with 0.21 and 0.42 μM LinA type 3, respectively; 280 and 480 μM γ-HCH were incubated with 4.51 and 11.27 μM LinA type 3, respectively; and 120 and 465 μM δ-HCH were incubated with 0.04 and 0.21 μM LinA type 3, respectively.

