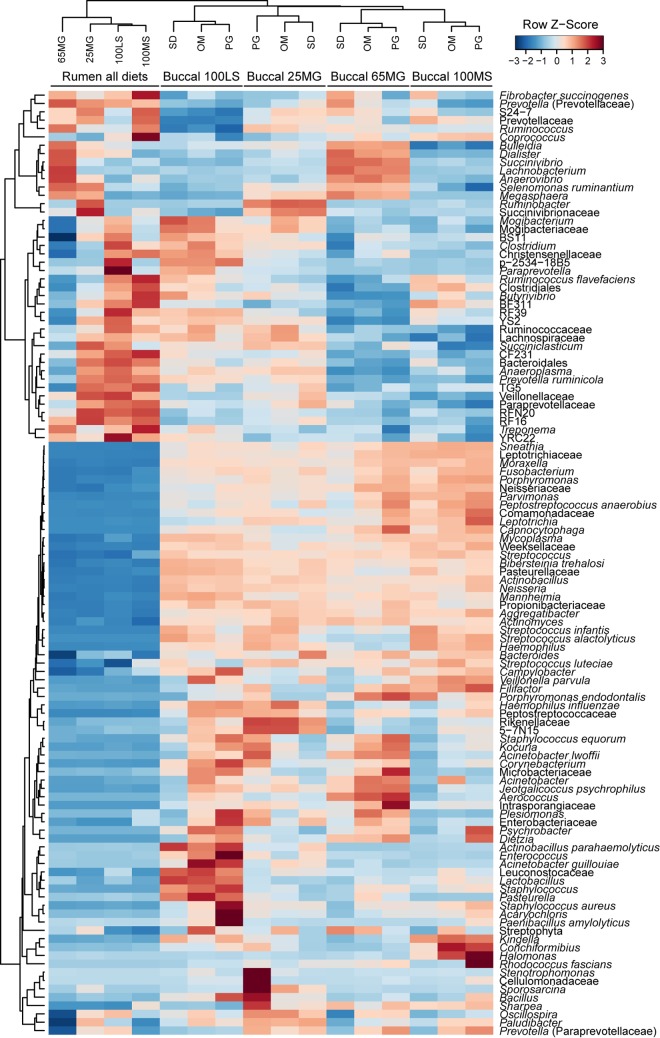
FIG 1.
Heat map of average bacterial taxon abundances in samples collected via buccal swabs (OM, PG, and SD) and stomach tubing (rumen) from sheep feeding on four different diets (100LS, 25MG, 65MG, and 100MS). Strong red colors indicate high standardized relative abundance values (row Z-scores), while dark blue colors indicate low standardized relative abundance values. Samples and taxa were clustered using Pearson correlation and hierarchical clustering with the average linkage method (n = 6 samples per diet and sampling method combination).

