
FIG 4.
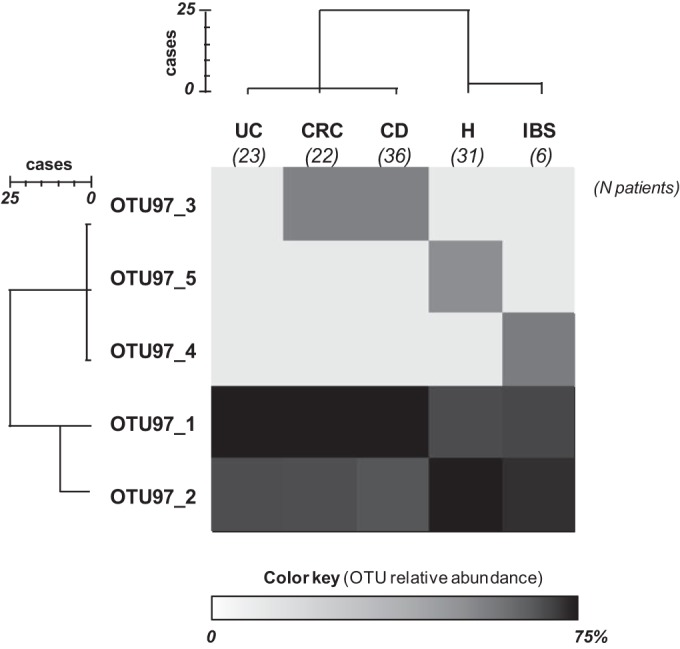
Heat map showing the relative abundance of sequences assigned to each operational taxonomic unit at a 97% level of 16S rRNA gene sequence similarity (OTU97 sequences) by group of subjects. Relative abundance was calculated as the percentage of sequences in an OTU from all sequences recovered from that group of patients. Hierarchical distance clustering showing a relationship between OTU97 sequences and groups of patients on the basis of their distribution (obtained using the intergroup joining method based on the Dice coefficient) is represented. The scale bar describes the similarity between profiles.