
. 2015 Aug 17;173(5):693–702. doi: 10.1530/EJE-15-0500
 This work is licensed under a
 Figure 3.
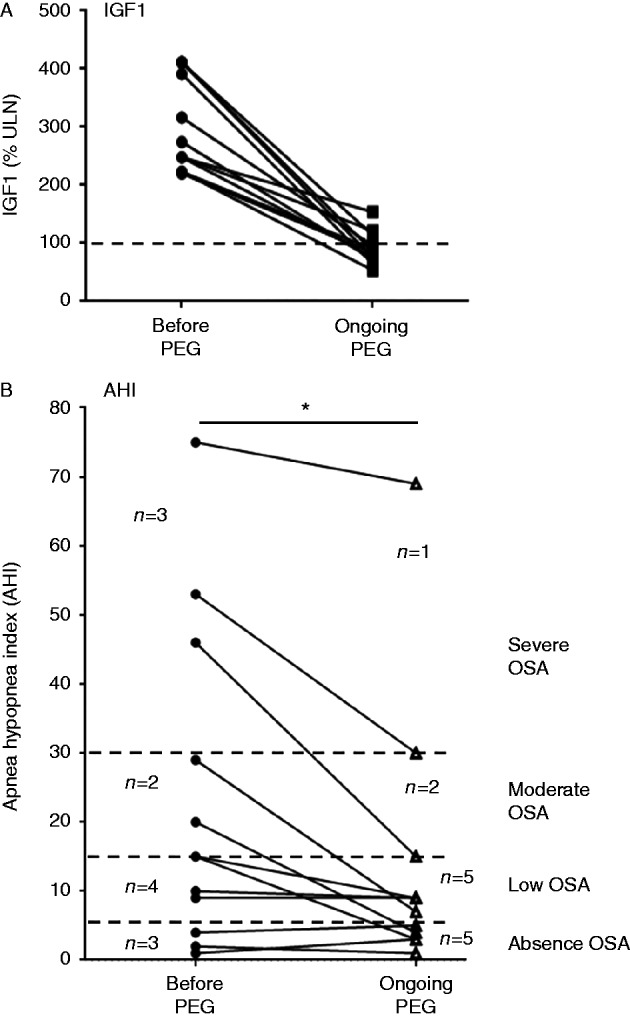
Effect of pegvisomant (PEG) on the apnea–hypopnea index (AHI) in 12 patients. Upper panel (A): individual IGF1 values in 12 patients before and during treatment with pegvisomant. IGF1 normalized (<115% ULN) in 10/12 patients (83%). Lower panel (B): changes in AHI on pegvisomant. Dotted lines represent the different stages of obstructive sleep apnea (OSA). Before pegvisomant: severe OSA (AHI >30/h, n=3), moderate OSA (15<AHI≤30/h, n=2), mild OSA (5<AHI≤15/h, n=4), no OSA (AHI≤5/h, n=3). On pegvisomant: severe OSA (n=1), moderate OSA (n=2), mild OSA (n=5), no OSA (n=5). Statistical significance: *P<0.05 (before pegvisomant vs on pegvisomant).