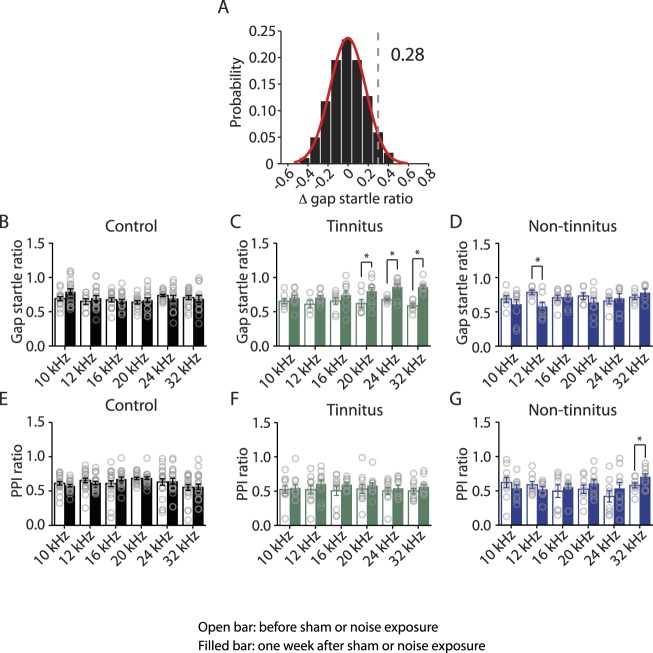
A. Probability distribution of changes in gap startle ratio (Δ gap startle ratio) in sham-exposed (control) mice. Δ gap startle ratio represents changes in control mice between postnatal day P17- P20 and P24 - P27. Data were fitted by a normal distribution (red curve, μ = −0.02, δ = 0.15, n = 21). Δ gap startle ratios smaller than 0.28 (dotted line), which is the point that is 2 standard deviations above the mean and is used as the threshold for evaluating tinnitus, represent 98.6% of the experimental Δ gap startle ratios and 98.5% of the fitted distribution. B. Summary graph of gap startle ratio for different frequencies of background for control mice: 10 kHz, before: 0.69 ± 0.03, n = 13, after: 0.79 ± 0.04, n = 17, p = 0.08; 12 kHz, before: 0.65 ± 0.04, n = 8, after: 0.70 ± 0.04, n = 18, p = 0.47; 16 kHz, before: 0.67 ± 0.03, n = 15, after: 0.66 ± 0.03, n = 18, p = 0.67; 20 kHz, before: 0.64 ± 0.02, n = 14, after: 0.67 ± 0.03, n = 18, p = 0.47; 24 kHz, before: 0.74 ± 0.02, n = 17, after: 0.69 ± 0.05, n = 14, p = 0.34; 32 kHz, before: 0.71 ± 0.03, n = 19, after: 0.69 ± 0.05, n = 16, p = 0.77. C. Summary graph of gap startle ratio for different frequencies of background for tinnitus mice: 10 kHz, before: 0.65 ± 0.04, n = 8, after: 0.70 ± 0.04, n = 10, p = 0.36; 12 kHz, before: 0.61 ± 0.06, n = 5, after: 0.71 ± 0.03, n = 10, p = 0.10; 16 kHz, before: 0.66 ± 0.05, n = 8, after: 0.74 ± 0.06, n = 10, p = 0.30; 20 kHz, before: 0.62 ± 0.06, n = 7, after: 0.80 ± 0.05, n = 11, p = 0.04; 24 kHz, before: 0.68 ± 0.02, n = 7, after: 0.86 ± 0.05, n = 9, p = 0.006; 32 kHz, before: 0.59 ± 0.03, n = 8, after: 0.86 ± 0.03, n = 12, p < 0.0001. D. Summary graph of gap startle ratio for different frequencies of background for non-tinnitus mice: 10 kHz, before: 0.69 ± 0.05, n = 7, after: 0.61 ± 0.07, n = 10, p = 0.40; 12 kHz, before: 0.78 ± 0.03, n = 6, after: 0.58 ± 0.06, n = 8, p = 0.02; 16 kHz, before: 0.71 ± 0.04, n = 6, after: 0.72 ± 0.04, n = 9, p = 0.83; 20 kHz, before: 0.73 ± 0.05, n = 6, after: 0.64 ± 0.06, n = 9, p = 0.32; 24 kHz, before: 0.66 ± 0.04, n = 7, after: 0.70 ± 0.07, n = 9, p = 0.67; 32 kHz, before: 0.71 ± 0.03, n = 7, after: 0.78 ± 0.05, n = 6, p = 0.26. E. Summary graph of PPI ratio for different frequencies of background sound for control mice: 10 kHz, before: 0.61 ± 0.02, n = 21, after: 0.58 ± 0.02, n = 21, p = 0.24; 12 kHz, before: 0.66 ± 0.03, n = 21, after: 0.62 ± 0.02, n = 21, p = 0.34; 16 kHz, before: 0.61 ± 0.04, n = 21, after: 0.68 ± 0.03, n = 19, p = 0.21; 20 kHz, before: 0.69 ± 0.02, n = 20, after: 0.69 ± 0.02, n = 21, p = 0.90; 24 kHz, before: 0.63 ± 0.05, n = 21, after: 0.64 ± 0.04, n = 19, p = 0.87; 32 kHz, before: 0.55 ± 0.04, n = 21, after: 0.56 ± 0.04, n = 21, p = 0.87. F. Summary graph of PPI ratio for different frequencies of background sound for tinnitus mice: 10 kHz, before: 0.52 ± 0.06, n = 11, after: 0.55 ± 0.05, n = 11, p = 0.79; 12 kHz, before: 0.52 ± 0.06, n = 11, after: 0.61 ± 0.05, n = 11, p = 0.32; 16 kHz, before: 0.51 ± 0.07, n = 11, after: 0.60 ± 0.03, n = 10, p = 0.24; 20 kHz, before: 0.53 ± 0.06, n = 11, after: 0.58 ± 0.04, n = 11, p = 0.51; 24 kHz, before: 0.50 ± 0.05, n = 11, after: 0.54 ± 0.04, n = 11, p = 0.56; 32 kHz, before: 0.50 ± 0.04, n = 11, after: 0.56 ± 0.04, n = 11, p = 0.28. G. Summary graph of PPI ratio for different frequencies of background sound for non-tinnitus mice: 10 kHz, before: 0.62 ± 0.08, n = 10, after: 0.54 ± 0.05, n = 10, p = 0.36; 12 kHz, before: 0.59 ± 0.05, n = 9, after: 0.52 ± 0.04, n = 9, p = 0.3; 16 kHz, before: 0.50 ± 0.09, n = 8, after: 0.55 ± 0.05, n = 9, p = 0.57; 20 kHz, before: 0.52 ± 0.06, n = 9, after: 0.61 ± 0.06, n = 10, p = 0.31; 24 kHz, before: 0.42 ± 0.08, n = 9, after: 0.54 ± 0.09, n = 10, p = 0.36; 32 kHz, before: 0.58 ± 0.04, n = 9, after: 0.71 ± 0.04, n = 10, p = 0.04. Asterisk, p < 0.05. Error bars indicate SEM.


