. 2015 Aug 27;4:e07242. doi: 10.7554/eLife.07242

Figure 7. Injection of KCNQ activators after noise exposure reduces the incidence of tinnitus development without affecting threshold and suprathreshold ABRs.

A. Percentage of mice that develop tinnitus (noise-exposed mice with intraperitoneal (IP) injection of vehicle, 50%, n = 18, noise-exposed mice with IP injection KCNQ channel activators, 25%, n = 20, p = 0.02). For noise-exposed mice with IP injection of vehicle (11 for retigabine vehicle and 7 flupirtine vehicle at 10 mg/kg); for noise-exposed mice with IP injection of KCNQ channel activators (10 for retigabine and 10 for flupirtine at 10 mg/kg). B. Summary graph of ABR thresholds from saline- (gray) and retigabine-injected (red) mice before (solid line) and 7 days after (dashed line) noise exposure and injection (n = 4–9, no statistical difference was observed between retigabine- and saline-injected mice). C. Summary graph of suprathreshold wave I amplitudes for noise-exposed mice + saline (gray) and noise-exposed mice + retigabine (red) before noise exposure for high frequency (20–32 kHz) sound stimulation (n = 5–15, no statistical difference was observed between retigabine- and saline-injected mice). D. Summary graph of suprathreshold wave I amplitudes for noise-exposed mice + saline (gray) and noise-exposed mice + retigabine (red) after noise exposure and injection for high-frequency (20–32 kHz) sound stimulation (n = 5–20, no statistical difference was observed between retigabine- and saline-injected mice). See end of the manuscript for detailed values for BD. Asterisk, p < 0.05. Error bars indicate SEM.

DOI: http://dx.doi.org/10.7554/eLife.07242.010

Figure 7.

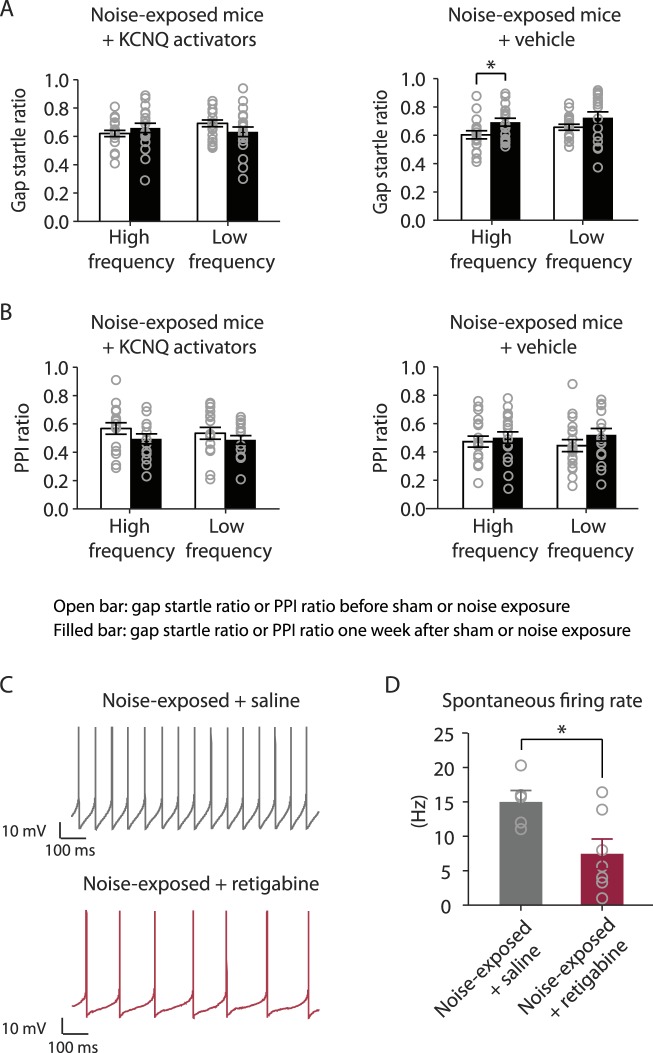
Figure 7—figure supplement 1. In vivo administration of KCNQ channel activators prevents the development of tinnitus and reduces the spontaneous firing rate of fusiform cells.

Figure 7—figure supplement 1.

A. Gap startle ratio of noise-exposed mice with KCNQ channel activator injection (high frequency background sound: before, 0.62 ± 0.02, after, 0.68 ± 0.02, n = 20, p = 0.06; low frequency background sound: before, 0.70 ± 0.02, after, 0.63 ± 0.03, n = 20, p = 0.06) and with vehicle injection (high frequency background sound: before, 0.61 ± 0.02, after, 0.70 ± 0.03, n = 18, p = 0.01; low frequency background sound: before, 0.66 ± 0.02, after, 0.72 ± 0.03, n = 18, p = 0.08). B. PPI ratio of noise-exposed mice with KCNQ channel activator injection (high frequency background sound: before, 0.56 ± 0.03, after, 0.49 ± 0.03, n = 20, p = 0.12; low frequency background sound: before, 0.54 ± 0.03, after, 0.48 ± 0.02, n = 20, p = 0.16) and with vehicle injection (high frequency background sound: before, 0.47 ± 0.03, after, 0.51 ± 0.03, n = 18, p = 0.11; low frequency background sound: before, 0.44 ± 0.04, after, 0.52 ± 0.03, n = 18, p = 0.36). C. Representative spontaneous action potentials of fusiform cells from noise-exposed mice injected with either saline (Upper trace, gray) or retigabine (Lower trace, red) twice a day for 6 days. D. Summary graph showing spontaneous firing rate of fusiform cells from noise-exposed mice injected with either saline or retigabine twice a day for 6 days (noise-exposed mice with saline: 15.0 ± 1.5 Hz, n = 5; noise-exposed mice with activator: 7.5 ± 2.2 Hz, n = 7, p = 0.02). Whole-cell voltage-follower mode recordings (current clamp, at I = 0) were performed 7 days after noise exposure and in the presence of excitatory and inhibitory receptor antagonists (20 μM DNQX, 20 μM SR95531, and 0.5 μM strychnine). Asterisk, p < 0.05. Error bars indicate SEM.