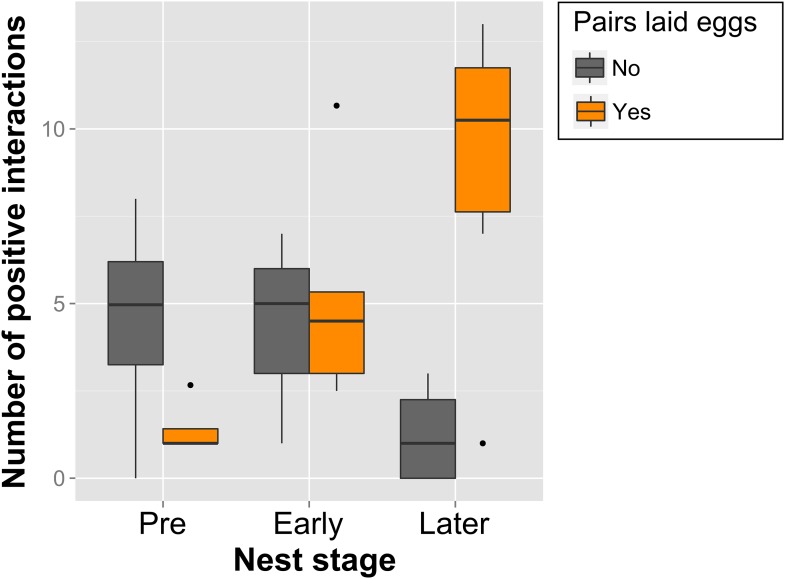
Figure 6. Call-type combinations associated with nest stages and successful egg-laying.
Boxplot of within-pair number of combinations with significant interaction (positive) over Pre- (nPre = 8), Early (nEarly = 8) and Later Nesting (nLater = 10) for pairs that were successful (orange, n = 6) and unsuccessful (grey, n = 4) at producing a clutch of eggs within the 3-week trials (Later Nest stage here refers only to Nest-building). Note the increase in call-type interactions of successful pairs across the Nest stages. Thick black horizontal line = median of observations, box = 25–75% quantile of observations (length = interquartile range), whiskers = last observation within 1.5 times the interquartile range the edge of the box, black dots = observations farther than 1.5 time the interquartile range from the edge of the box. Source data are available at http://datadryad.org/review?doi=doi:10.5061/dryad.vt69s.

