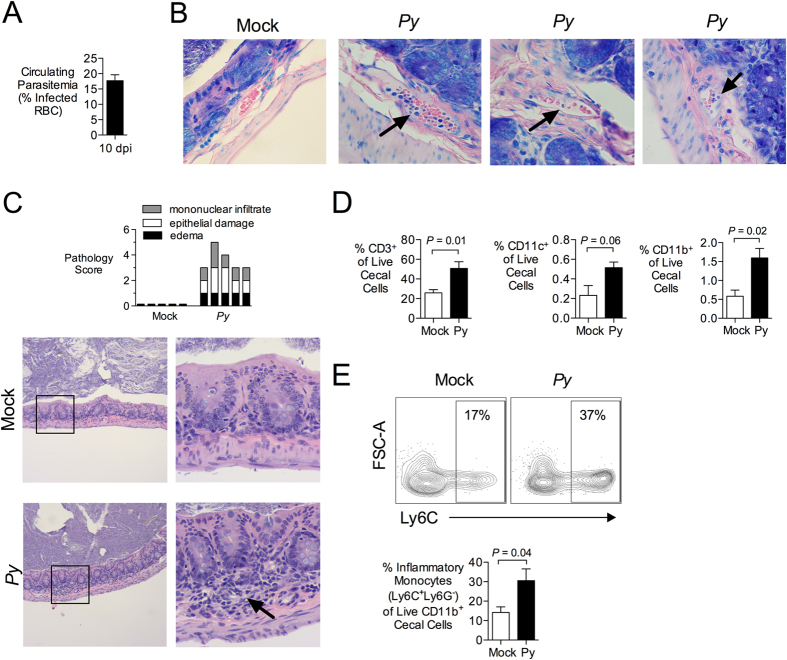
Figure 1. Infection with Plasmodium yoelii induces intestinal inflammation.
(A) C57BL/6J mice were infected intraperitoneally (ip) with 4 × 10⁷ infected red blood cells (iRBC). Parasitemia at 10 days post malaria was determined on Giemsa-stained blood smears and the percentage of iRBC is displayed as mean + SEM for all mice used in panels B–E (n = 10). (B) At 10 days post P. yoelii (Py) inoculation, iRBC were present in blood vessels of paraffin-embedded cecal tissues stained with Giemsa (n = 3 separate pyn mice). Images were acquired with a 60× objective. Black arrows indicate parasites inside blood vessels. (C) Blinded histopathological analysis of P. yoelii-induced alterations to the intestinal mucosa. Criteria for scoring are provided in Table S1. Each bar represents an individual mouse (n = 5). Images were acquired with a 10× objective (left panel) and 40× (right panel). Arrow indicates mononuclear inflammation. (D,E) Flow cytometric analysis of cell suspensions from cecal mucosa obtained 10 d after P. yoelii inoculation. (D) Percentage of CD3, CD11b or CD11c expressing live, singlet cecal cells. Mean + SEM (n = 5). (E) Percent of Inflammatory Monocytes (Ly6G− Ly6C+) within the fraction of live, singlet cecal cells expressing CD11b. Mean + SEM (n = 5). Gating strategy and additional representative dot plots are shown in Fig. S1. Significance for differences between experimental groups was determined using Student’s t test on logarithmically transformed data. Mice were housed in groups of 4–5 per cage.

