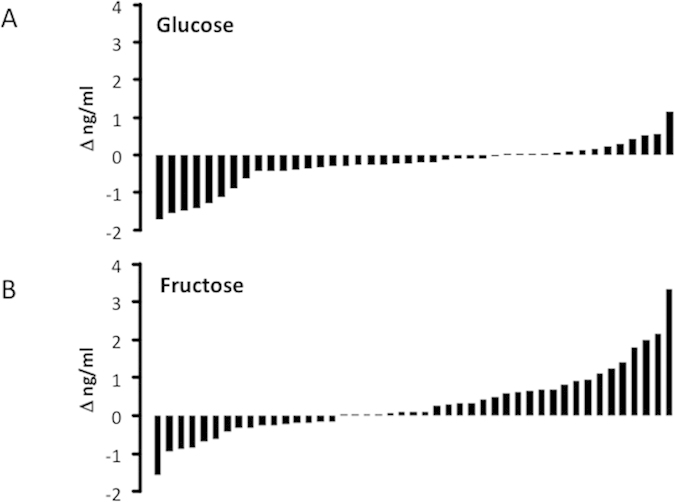
Figure 2. Individuals vary in their response to glucose or fructose consumption.

(A) Change in plasma adropin concentrations (Δ ng/ml) with glucose consumption in individuals. (B) Change in plasma adropin concentrations with fructose consumption in individuals. The data shown in panels (A,B) are combined from Study (A) and Study (B).
