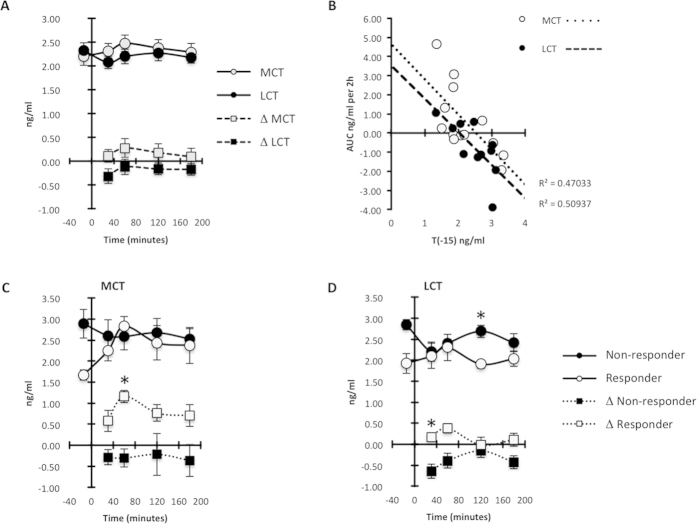
Figure 4. Effects of MCT or LCT consumption on plasma adropin concentrations suggests a responder/nonresponder situation.
(A) Averages in the absolute values and delta (Δ, values at the various time points minus baseline) following MCT or LCT consumption. (B) Inverse association between the area under the curve (AUC) for the change in plasma adropin concentrations and baseline values taken 15 minutes before consumption of meals containing MCT or LCT. (C) Individuals who are “responders” exhibit a marked increase in plasma adropin concentrations after consumption of MCT when compared to “low responders”. “High responders” are characterized by having low plasma adropin concentrations at baseline, with MCT consumption increasing plasma adropin levels to that observed in “low responders”. *P < 0.05. (D) The distinction between responders and nonresponders following LCT consumption is less clear. While the Δ in plasma adropin was higher in responders, this was due to nonresponders showing a marked decline in adropin following consumption of the meal.

