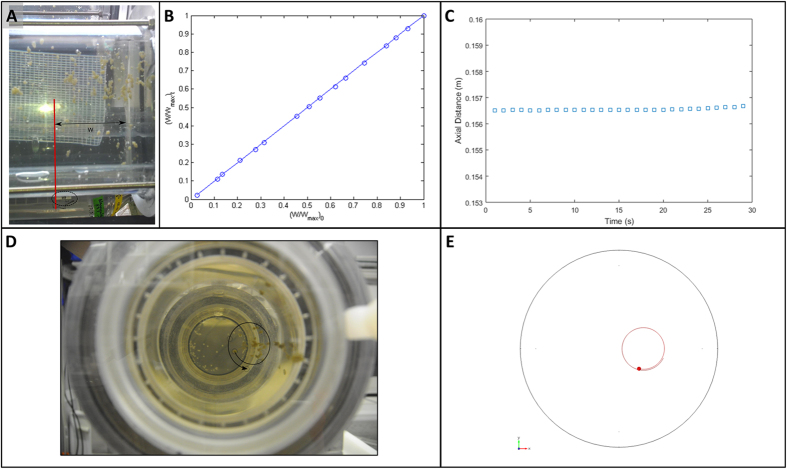
Figure 4.
(A) We draw a red line on the left edge of the white band glued on the outer cylinder, highlighted by the black ellipse. From this fixed reference line, the horizontal displacement of each particle from its initial position can be traced versus time. (B) The experimentally captured relative displacements (W/Wmax)t of 15 randomly chosen particles from 30 subsequent images have been plotted versus their initial displacements (W7Wmax)0. All particles were found to move in the axial direction from their original positions only by less than 0.8% hinting toward a quasi-2D spiral motion. (C) Numerically obtained axial displacement the aggregate particles versus time. (D) The experimentally determined path of a randomly selected particle after 50 seconds. (E) The counterpart of image d as predicted by numerical simulation.

