
Figure 3. Cellular mechanics of MDCK II cells after PIP2 microinjection.
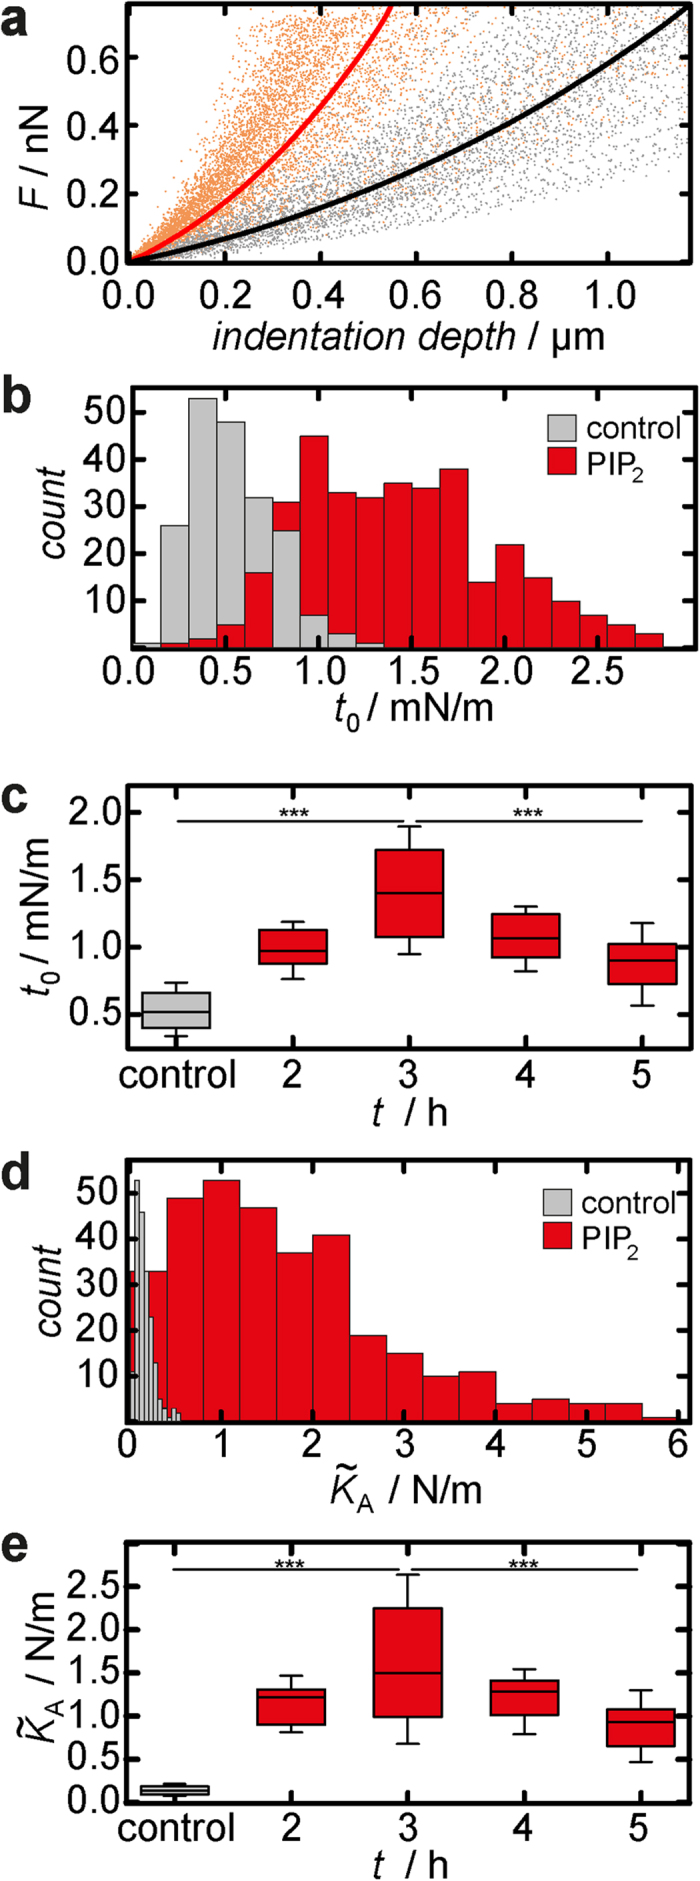
(a) Averaged indentation curves for PIP2 microinjected (red) and control cells (black). (b,c) Overall tension  . (d,e) Apparent area compressibility modulus
  . (b, d) Histograms obtained from analysis of force indentation curves on control cells (grey) and 3 h after injection of PIP2 (red). (c,e) show
  and
and  as a function of elapsed time after PIP2 injection. Box plots extend from the 30th to the 70th percentile, whiskers from the 20th to the 80th. Grey bars in the histograms and box plots refer to data obtained from untreated cells, red ones represent PIP2 microinjected cells. (b,c) n = 196 (control), 132 (2 h), 106 (3 h), 101 (4 h), 71 (5 h) analysed force distance curves. (d,e) n = 196 (control), 132 (2 h), 102 (3 h), 101 (4 h), 71 (5 h) analysed force distance curves. n > 5 (control), n = 3 (PIP2) analysed cells. Asterisks indicate a statistical difference (***p < 0.001, Wilcoxon rank sum test).