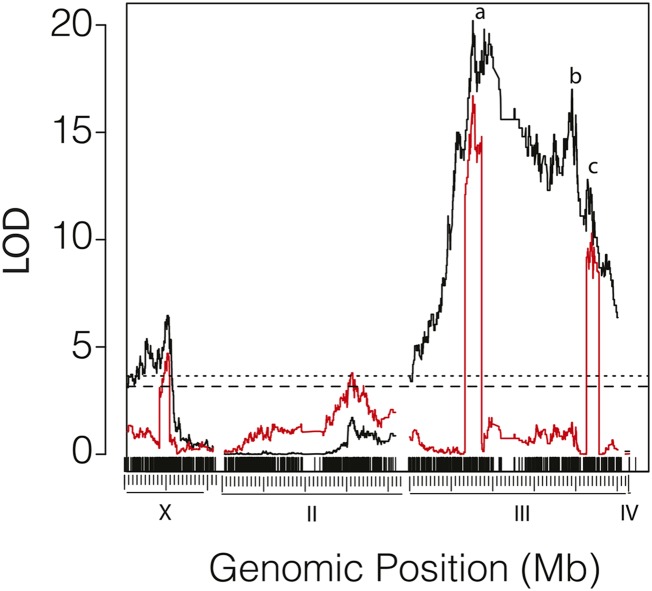
Figure 4.
QTL map of M. citrifolia resistance in the D. sechelliaw30 backcross using interval mapping (black) and composite interval mapping (red). The log of the likelihood ratio (y-axis) is plotted against physical distances (x-axis). The locations of markers are shown in the upper row of vertical ticks. The genomic locations are given in the bottom row of vertical ticks; each large tick is 10 Mbp, and the smaller ticks show 1-Mbp intervals. Dashed and dotted lines indicates the threshold for LOD scores at the 0.05 and 0.01 significance levels, respectively. The locations of QTL-IIIseca (A), QTL-IIIsecb (B), and QTL-IIIsecc (C) are indicated.

