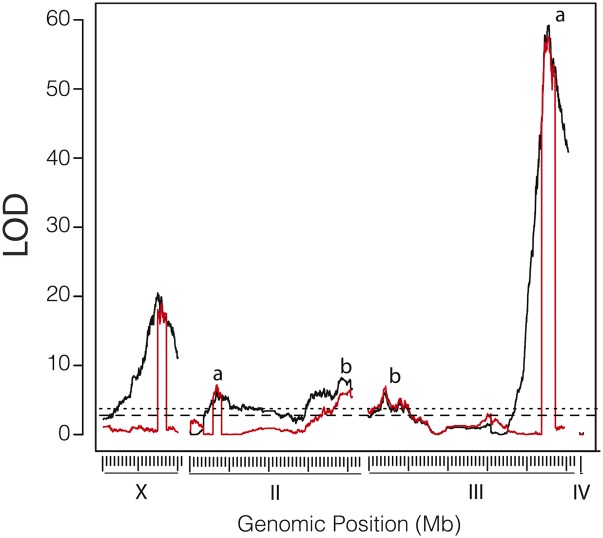
Figure 5.
QTL map of M. citrifolia resistance in the D. simulansNueva backcross using interval mapping (black) and composite interval mapping (red). (A) LOD scores vs. genomic position for the four chromosomes. The upper rug of ticks shows the location of markers, whereas the lower tick marks indicate 1- and 10-Mbp intervals along each chromosome. The significance thresholds for the 0.05 and 0.01 levels of the LOD scores are shown by the dashed and dotted lines, respectively. The lower case letters indicate the locations of QTL-IIIsecha, QTL-IIIsechb, and QTL-IIIsechc. QTL-IIsecha and QTL-IIsechb. (B) Effect plot for QTL-IIIsima showing the phenotypic effect of substituting a D. simulansNueva allele (sim) for a D. sechelliaw30 allele (sec) at the marker 3:46,954,562, where 0 = lethality and 1 = survivorship to puparium formation.

