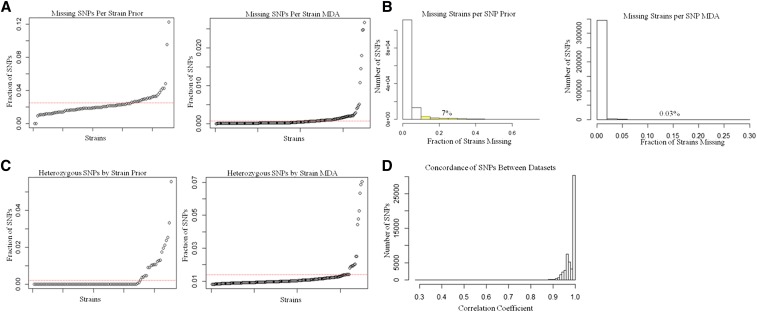
Figure 1.
Comparisons of Prior genotypes with Mouse Diversity Array (MDA) genotypes. (A) Fraction of single-nucleotide polymorphisms (SNPs) with missing calls in each strain for Prior (left) and MDA (right) genotypes. The red line indicates the average value. (B) Histogram showing the proportion of missing strains for each SNP for the prior (left) and MDA (right) genotypes. Highlighted in yellow and displayed as a percentage are the numbers of SNPs with more than 10% missing values (7% for prior, 0.03% for MDA). (C) Fraction of heterozygous SNPs within each strain for prior (left) and MDA (right) genotypes. The red line indicates the average value. (D) Histogram of concordance between SNPs found in both genotyping sets.

