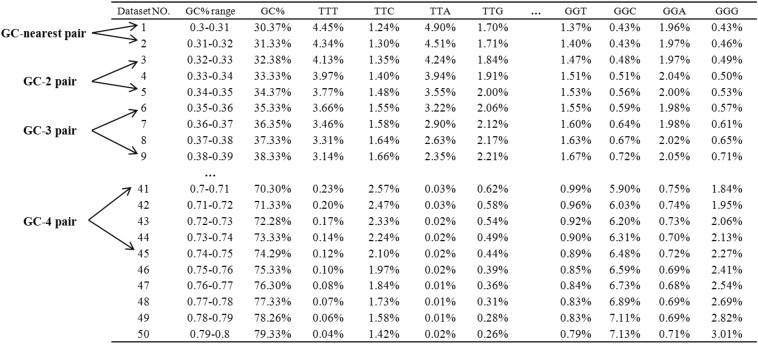
Figure 1.
The schematic diagram of codon usage analysis. As is shown in the figure, the table represents some of the codon usage results of 50-consecutive codon group and the table was sorted by the GC-content range of each group. The first column is the number of each dataset line; the second column lists the GC-content range of each 50 consecutive codon group; the third column is the average GC-content of each group; and the remaining columns show the usage frequencies of each synonymous codon. GC-nearest pair consists of two datasets with the nearest GC-content (i.e., the nearest dataset line number, such as datasets 1 and 2, 3 and 4, …, 49 and 50 in the table); GC-N pair consists of two datasets with larger GC-content divergence and N is the discrepancy between the number of any two datasets (e.g., GC-2 pairs contain the pairs of datasets 1 and 3, 2 and 4, 3 and 5…48 and 50; GC-3 pairs contain the pairs of datasets 1 and 4, 2 and 5, 3 and 6 … 47 and 50).

