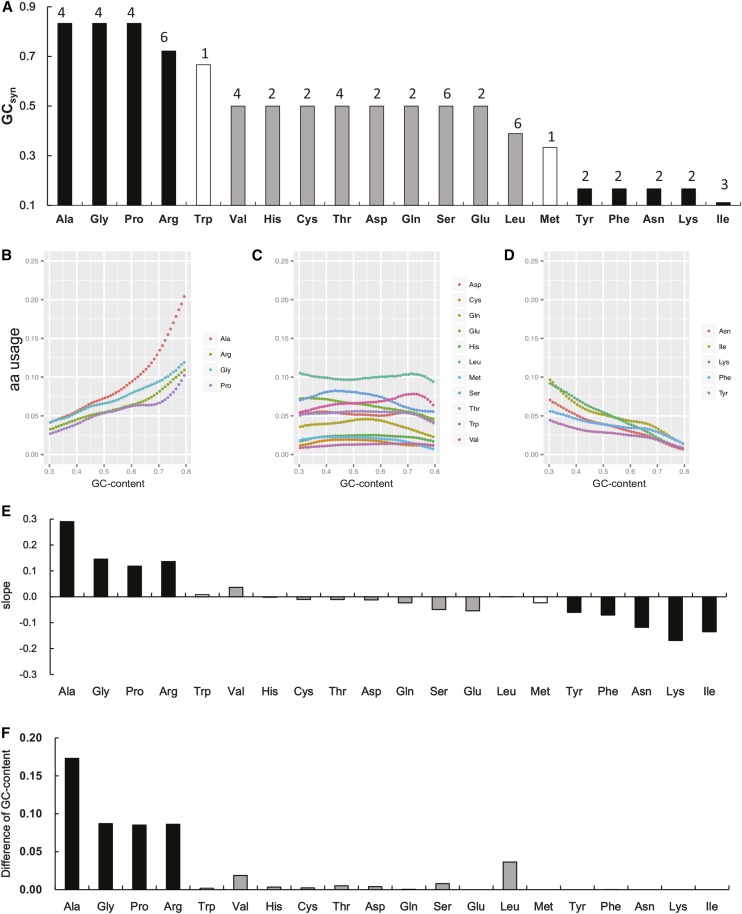
Figure 2.
Patterns of amino acid usage and its GC-content of synonymous codons in 65 nuclear genomes in this study. (A) Average GC-content of codons for an amino acid based on the standard DNA genetic code table; the numbers on the bars are the number of synonymous codons for each amino acid; (B−D) Usage frequency variation of amino acids in three groups along with the regional GC-content (in 50 consecutive codons analyze unit), (E) is the slope value in a linear regression analysis for the lines in B−D, and (F) is for the absolute increased GC-content for each amino acid between regions with 0.3−0.31 and 0.79−0.80 GC-content. The black and nonblack bars represent the variably and the less-variably used amino acids, respectively.

