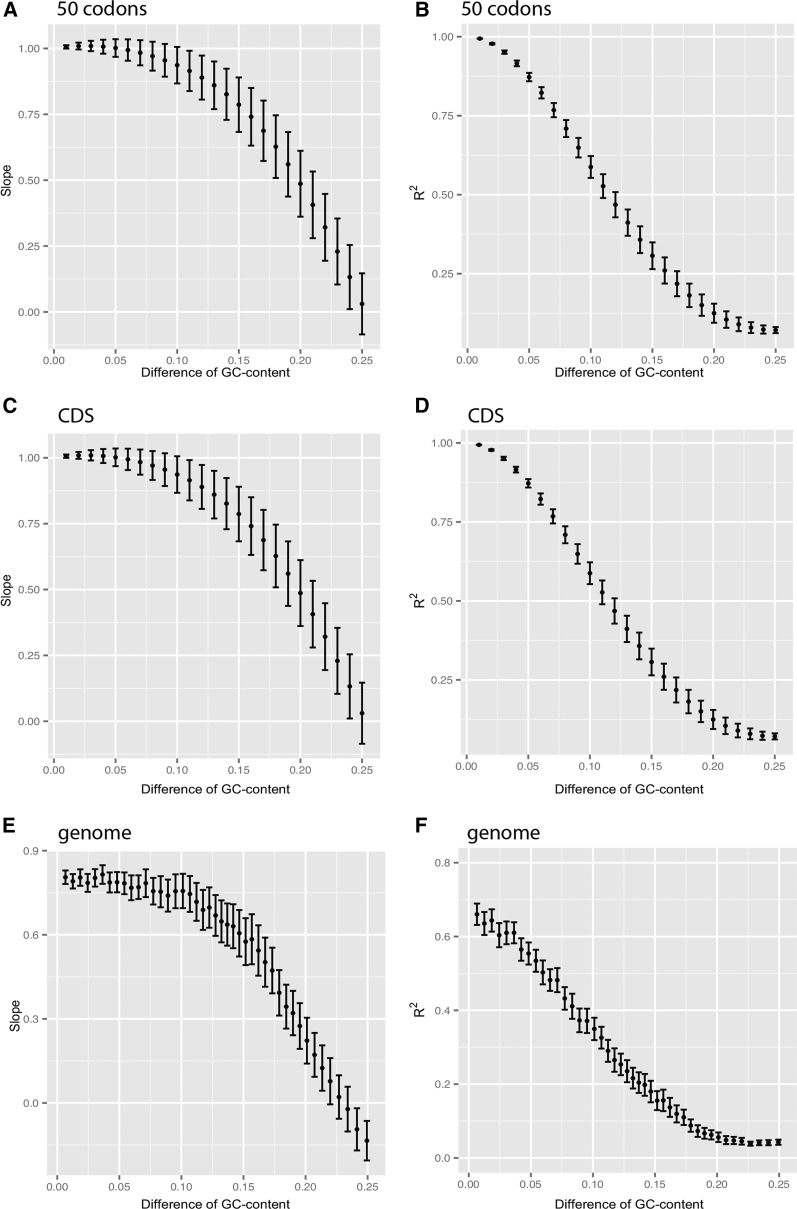
Figure 5.
The patterns of the correlation slope (A, C, and E) and the coefficient of determination R2 values (B, D, and F) for codon usages between different GC groups. Fifty-codon (A and B), CDS (C and D), and whole genome (E and F) were used respectively as an analysis unit, with a GC-content difference less than 0.25 (the values are nearly 0 when ΔGC > 0.25). As shown in 50 consecutive codons (A and B) and CDS (C and D) analysis units, when the difference of GC-content from two compared units is 0 (x-axis), both the linear regression slope and the regression coefficient R2 are infinitely approaching 1 (P = 2.32e-54), which strongly suggests that codon usage frequencies are nearly constant in regions with similar GC-content.

