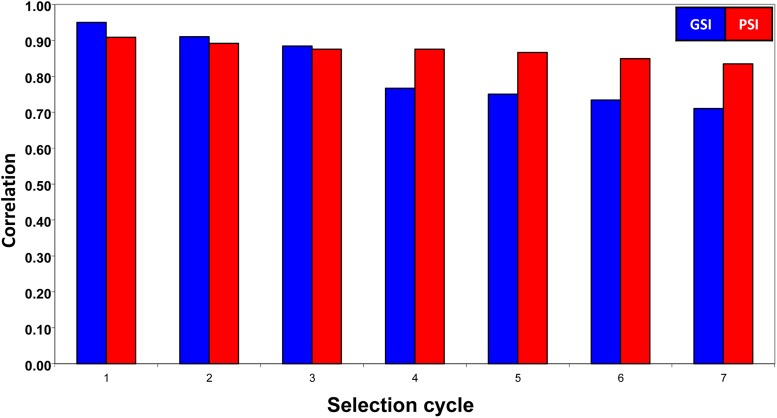
Figure 3.
Correlation between the genomic selection index (GSI), the phenotypic selection index (PSI), and the true net genetic merit (H) values in seven selection cycles. For each cycle of selection, the first column corresponds to the correlation between the GSI estimated values and the H true values (blue), whereas the second column corresponds to the correlation between the PSI estimated values and the H true values (red).

