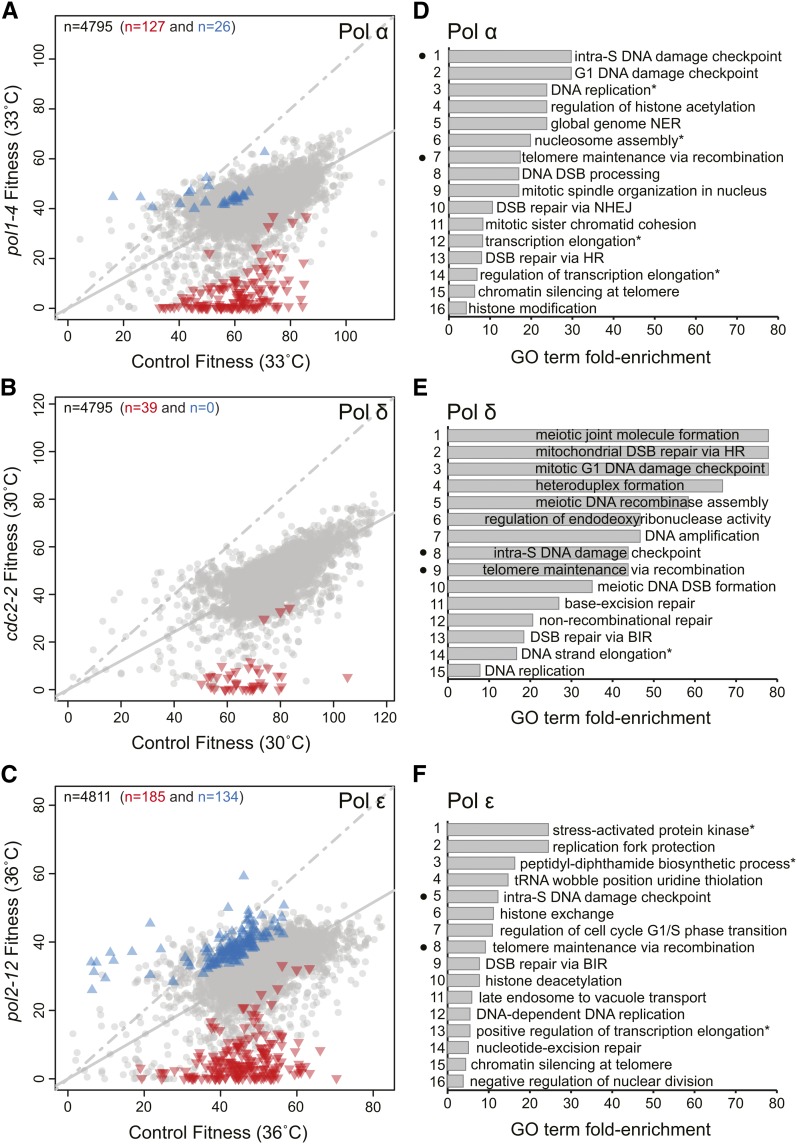
Figure 1.
Genetic interactions that affect DNA polymerase functions. (A) Fitnesses of yeast strains with yfgΔ-d mutations in pol1-4 or lyp1Δ genetic backgrounds and cultured at 33°. Each symbol shows the effect of a single yfgΔ-d in the two contexts, and the total number of yfgΔ-d genes shown is indicated by the number in top left corner of the plot. The solid gray line is a linear regression through all points, and the dashed line is the line of equal fitness (if there were no fitness cost caused by pol1-4 at 33°). Statistically significant positive genetic interactions with pol1-4 are represented by blue triangles, negative genetic interactions by red inverted triangles, and the remaining observations by gray dots. The numbers of significant interactions are indicated by the colored numbers across the top of the plot. (B) Same as in (A) but for DNA polymerase δ (Pol δ) mutation (cdc2-2) at 30°. (C) Same as in (A) but for the DNA polymerase ε (Pol ε) mutation (pol2-12) at 36°. (D) A ranked list of enriched biological process Gene Ontology (GO) terms across the negative genetic interactions identified for pol1-4. The complete list of enriched terms GO terms and classifications are found in Table S3. Black dots correspond to the common terms found enriched in the DNA polymerase α-primase (Pol α), Pol δ, and Pol ε screens. The asterisk indicates that the GO term has been abbreviated from Table S3. (E) Same as in (D) but for Pol δ mutation (cdc2-2) at 30°. See Table S4 for the complete list of enriched terms GO terms. (F) Same as in (D) but for the Pol ε mutation (pol2-12) at 36°. See Table S5 for the complete list of enriched terms GO terms.

