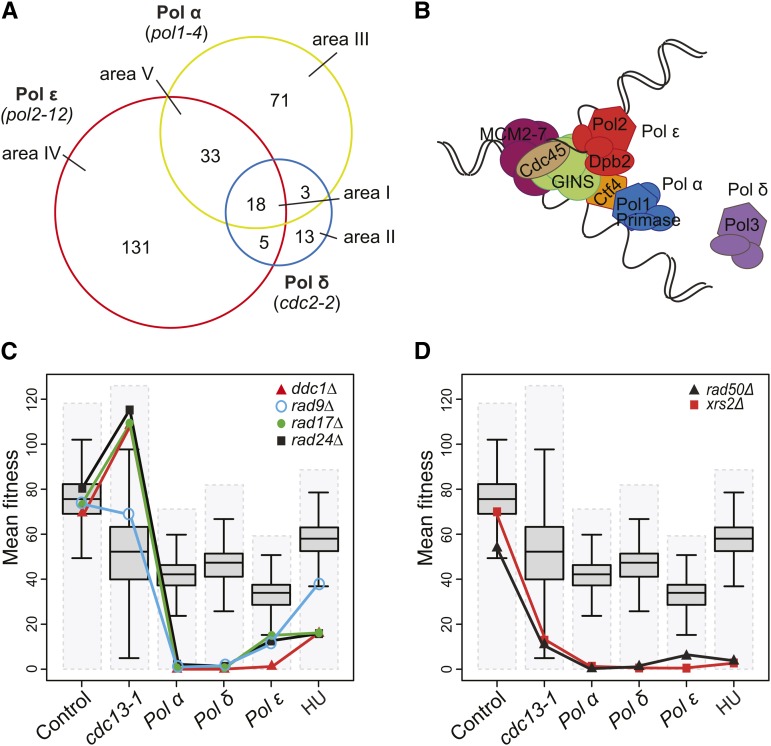
Figure 2.
Specificity of genetic interactions. (A) Venn diagram showing overlaps between negative genetic interactions that affect cells with a DNA polymerase α-primase (Pol α) mutation (pol1-4), DNA polymerase δ (Pol δ) mutation (cdc2-2), or DNA polymerase ε (Pol ε) mutation (pol2-12) (Table 1 and Table S6). (B) A simplified view of the replication fork based on Sengupta et al. (2013). Pol ε binds to origins via Dpb2-GINS interaction. Pol ε remains associated with the CMG helicase (Cdc45-MCM2-7-GINS) during the leading-strand synthesis. Pol α-primase is coupled to the CMG helicase via Ctf4 and initiates the DNA synthesis on both strands. Pol α is replaced by Pol δ on the lagging-strand to extend the nascent strand. Note: for simplicity, numerous essential replication factors have been omitted (i.e., PCNA, RFC, Dpb11 etc.) (C) Fitness profiles of gene deletions affecting the DNA damage checkpoint (ddc1Δ, rad9Δ, rad17Δ, and rad24Δ) in combination with lyp1Δ (control), cdc13‐1, pol1-4, pol2-12, and cdc2-2 mutations and in presence of 100 mM hydroxyurea (HU). Dashed gray boxes represent the fitness range of the double-mutants in each screen. Box plots show 50% range, the whiskers represent 1.5-fold the 50% range from the box, and the horizontal black line is the median fitness. (D) Fitness profiles of gene deletions affecting the Mre11 complex (rad50Δ and xrs2Δ) as in C).

