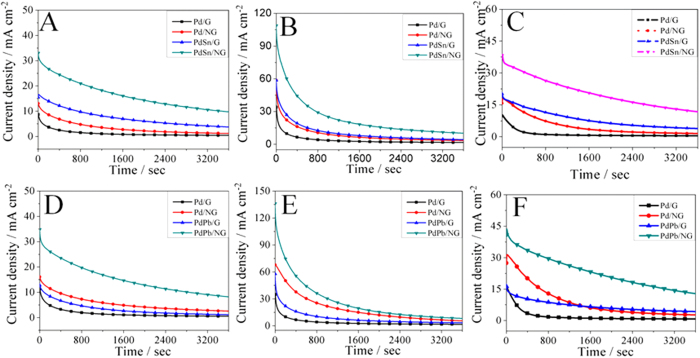
Figure 6.
Current–time curves of Pd/G, Pd/NG, PdSn/G and PdSn/NG in 1 M KOH + 1 M methanol(A)/1 M ethanol (B)/0.5 M ethylene glycol (C) solution at the potential of –0.15 V; Current–time curves of Pd/G, Pd/NG, PdPb/G and PdPb/NG in 1 M KOH + 1 M methanol (A)/1 M ethanol (B)/0.5 M ethylene glycol (C) solution at the potential of –0.15 V.

