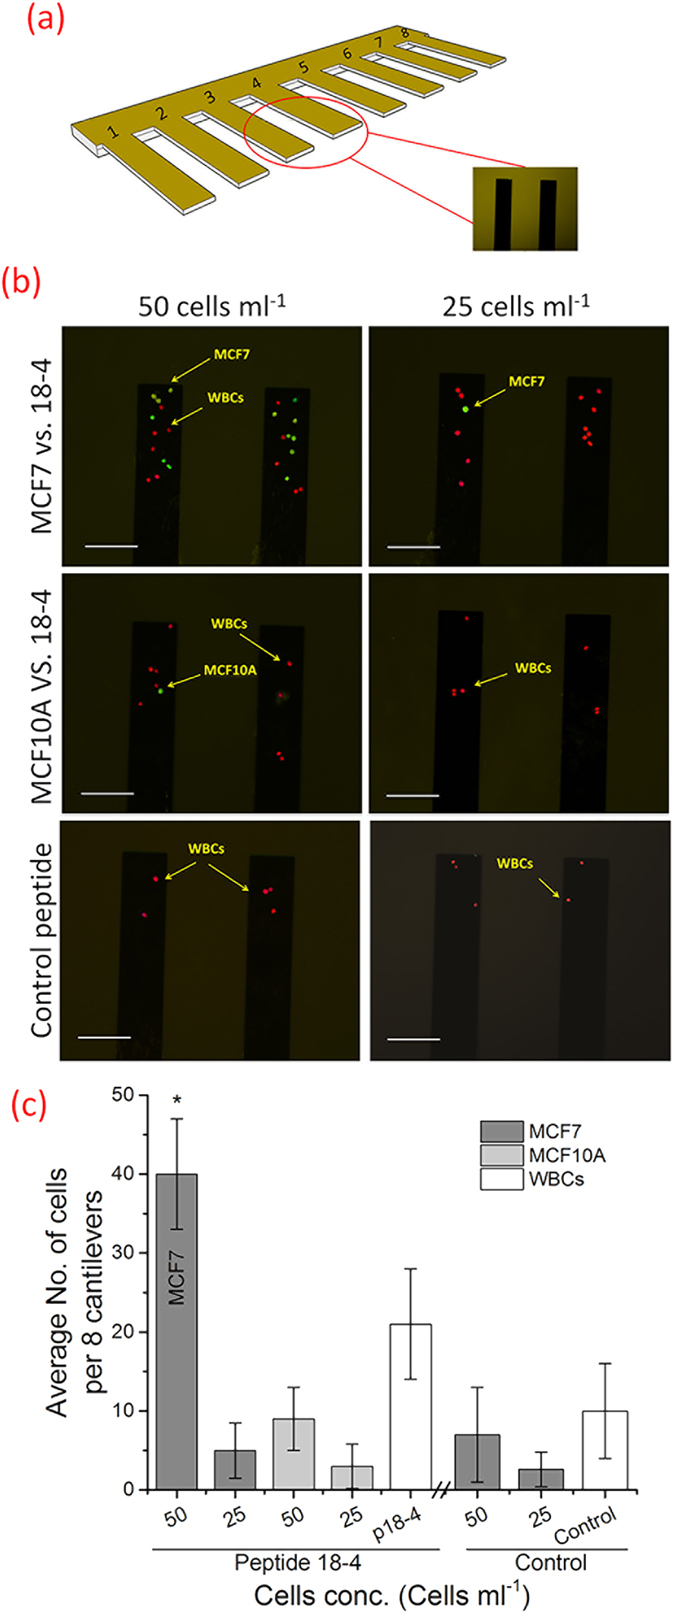
Figure 6. Cancer cell capture on the peptide coated microcantilevers (eight) using fluorescence microscopy.

(a) Schematic of 8 cantilevers used to capture cancer cells when exposed to 50 or 25 cells/mL sample. (b) Fluorescence microscope images of the captured cells (MCF-7 or MCF10A) on the peptide-coated (18-4 or control) microcantilevers (two of the eight cantilevers are shown here). The eight cantilevers were exposed to MCF7 or MCF10A spiked whole blood samples (50 or 25 cells/mL). MCF7 or MCF10A cells and the white blood cells (WBCs) were stained separately, green and red, respectively, before mixing. Scale bar is 100 μm. (c) The average number of captured cells per 8 microcantilevers as computed from the set of fluorescence microscopy images. Assay was repeated five times, and mean ± SD is presented. The P values were computed using the unpaired t-test to signify the statistical difference between the comparable groups.
