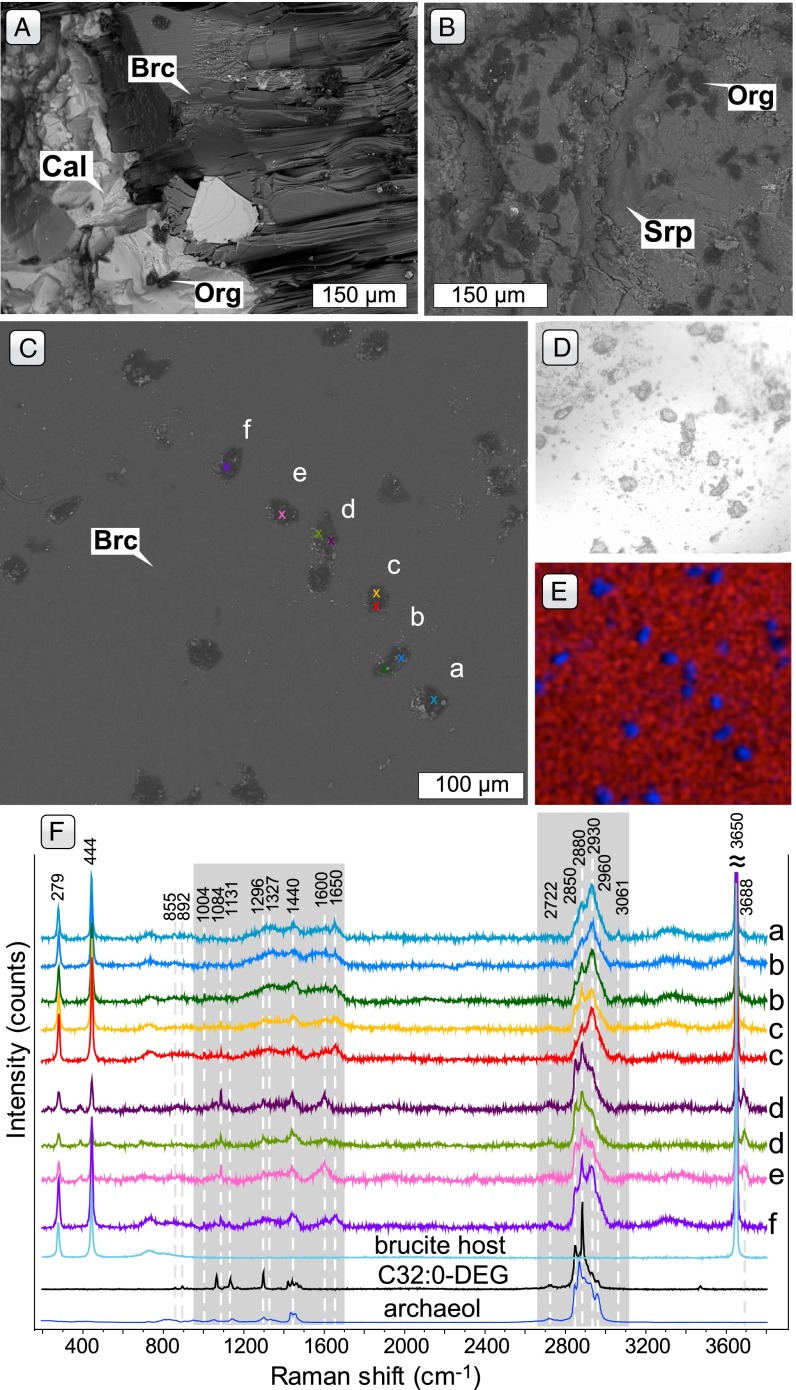
Fig. 4.
Examples of fossilized colonies of microorganisms in sample 897D-17R6, 0–5 cm. (A) BSE image of concretions of organic matter (Org) interpreted to be fossil microbial microcolonies in calcite (Cal) and sheets of brucite (Brc). (B) BSE image of concretions of organic matter interpreted to be fossil microbial microcolonies at a contact between a brucite−calcite vein and the serpentinite host. (C) BSE image of microcolonies in brucite. Negative crystal shapes of brucite are visible in some inclusions. Color-coded crosses and labels refer to Raman spectra shown in F. (D) Optical photomicrograph of same microcolonies as shown in C and E. (E) Element map of microcolonies, carbon (blue) and magnesium (red). (F) Raman spectra of brucite-hosted microcolonies illustrated in C−E. Raman spectra of the brucite host, and 1,2-Di-O-hexadecyl-rac-glycerol (C32:0-DEG, ≥99%) and 1,2-Di-O-phytanyl-sn-glycerol (archaeol, >99%) lipid standards are shown for comparison.

