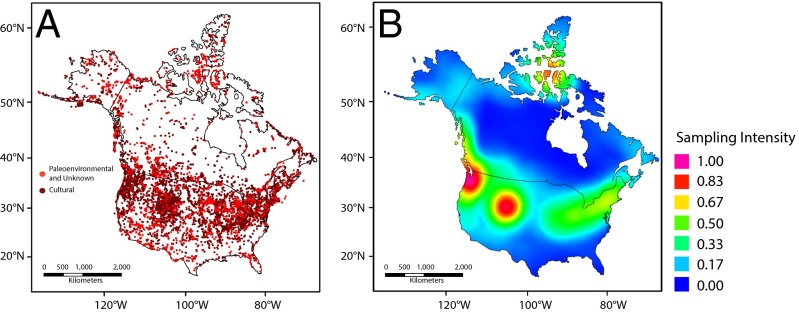
Fig. 1.
Locations of the archaeological sites in the CARD and the sampling intensity base map. (A) Distribution of the CARD sites including dated cultural, paleoenvironmental, and unknown material. (B) Sampling intensity base map produced using all geographically distinct cultural and paleoenvironmental dates spanning the full age range in the CARD, such that multiple dates at the same location are considered as one.

