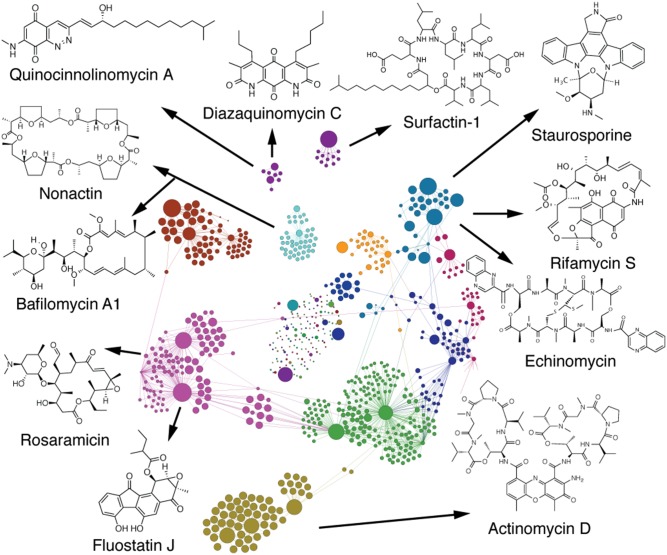
Fig. 3.
Annotated Compound Activity Map. An expanded view of the Compound Activity Map from Fig. 1C, with the extracts and m/z features separated into subclusters and colored coded using the Gephi modularity function. Each bioactive subcluster is composed of extracts containing a family of compounds with a defined biological activity. The Compound Activity Map is annotated with a representative molecule from each of the families of compounds that have been independently confirmed by purification and chemical analysis.

