Fig. 4.
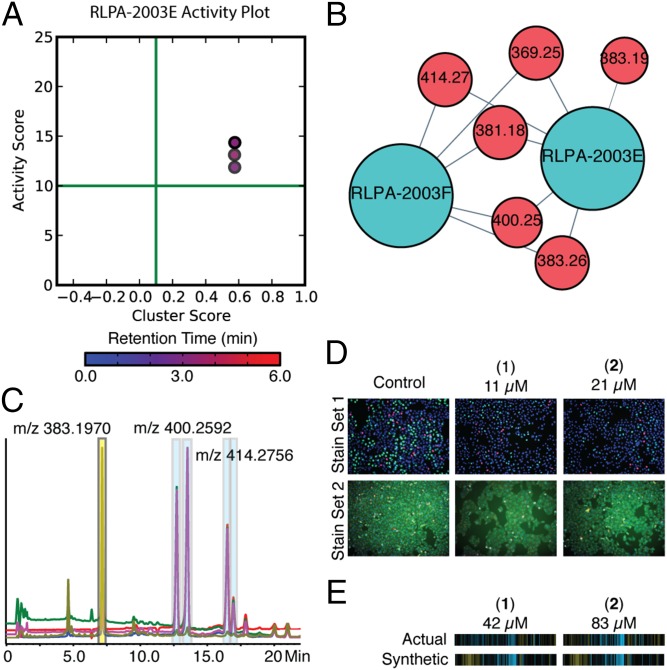
The prioritization, isolation, and confirmation of the quinocinnolinomycins A–D (1–4). (A) Bioactive m/z features plotted on a graph of activity score vs. cluster score. The color of the dot corresponds to the retention time of the m/z feature with the color bar and scale below in minutes. (B) Isolated cluster from Fig. 1C and Fig. 3 containing both the relevant extracts (blue) and bioactive m/z features (red). (C) HPLC trace of extract RLPA-2003E and the isolation of quinocinnolinomycins A–D (highlighted with blue boxes on HPLC trace). (D) Cell images of pure compounds screened as a twofold dilution series for quinocinnolinomycins A and B in both stain sets compared with images of vehicle (DMSO) wells. (E) Comparison of the synthetic and actual cytological fingerprints of the pure compounds is presented below the relevant images, demonstrating the relationship between experimental and calculated cytological profiles for these two metabolites.

